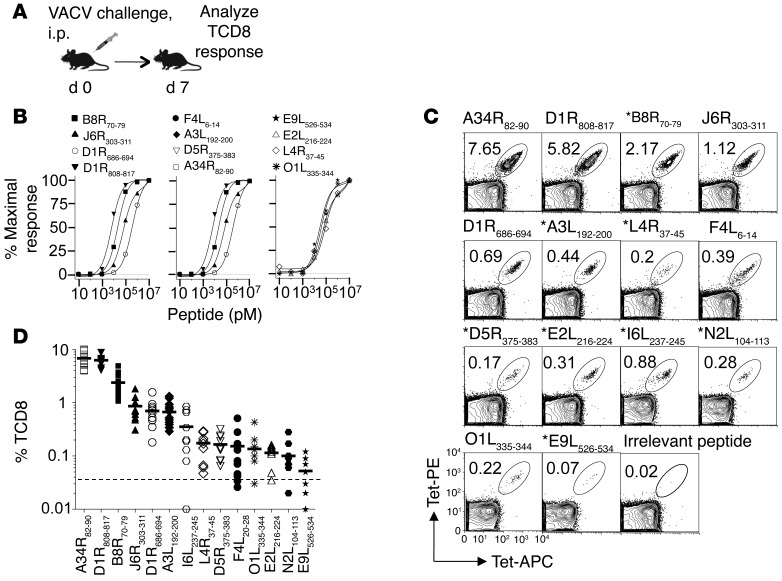
Figure 2. Tracking VACV-specific TCD8 responses in B7 transgenic mice.
(A) Experimental design. B7tg mice were inoculated i.p. with 2 × 10⁵ pfu VACV, and splenic TCD8 response was characterized on day 7. (B) Dose-dependent IFN-γ response by VACV-immune splenocytes measured by epitope titration in the ELISpot assay. Data represent the mean of triplicate wells and are representative of 2 independent experiments (n = 5). (C) TCD8 responses detected using p/B7.2 tetramers on VACV-immune splenocytes. Data are representative of at least 3 independent experiments using pooled spleens (n = 5–10). Numbers indicate the percentage of CD8+ p/B7.2 tetramer+ cells. The asterisks indicate novel immune epitopes. (D) VACV-specific TCD8 hierarchy defined by p/class I tetramer staining of VACV-immune splenocytes. Cumulative data from 3 to 13 independent experiments (n = 5–8). Each symbol represents TCD8 frequency from 1 experiment. The dotted line indicates assay background defined by irrelevant HMPV-derived TCD8 epitope/B7 tetramer binding (68). Horizontal bars indicate the mean.

