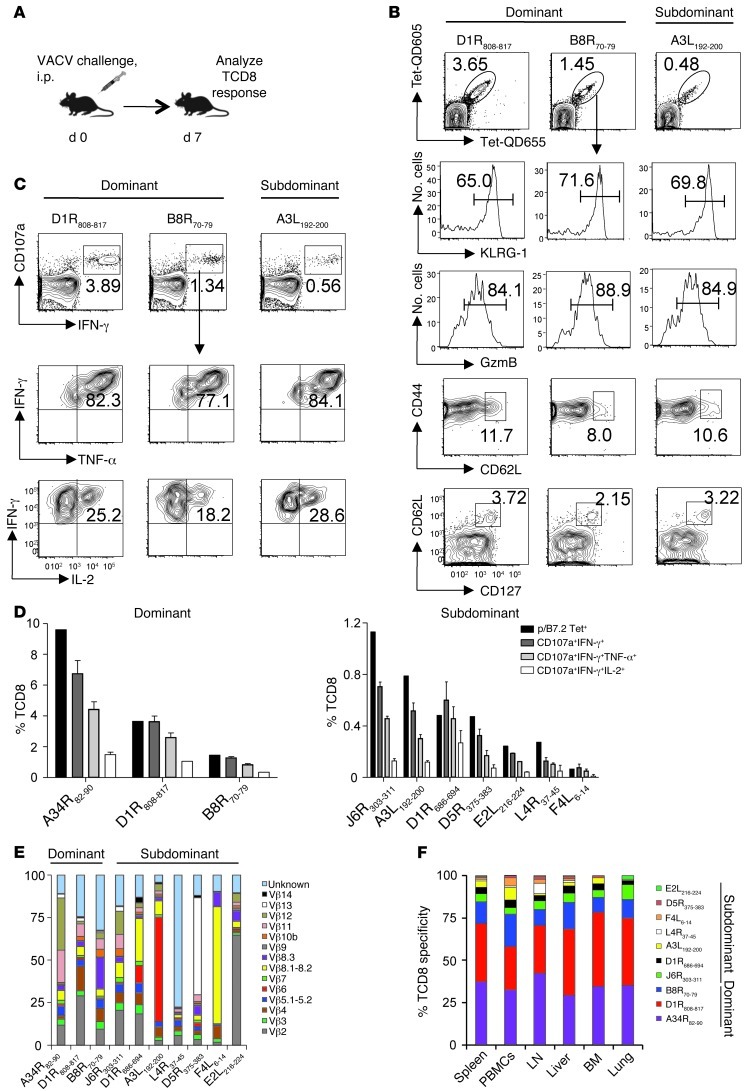
Figure 3. Individual TCD8 exhibit similar phenotype, functional competence, and homing pattern.
(A) Experimental design. B7tg mice were inoculated i.p. with 2 × 10⁵ pfu VACV, and the TCD8 response was characterized on day 7. (B) Dominant (D1R808–817, B8R70–79) and subdominant (A3L192–200) TCD8 specificities identified in VACV-immune spleens acquired similar effector (CD44hiCD62LLOGzmB+KLRG1hi) and memory (CD44hiCD62LhiCD127hi) phenotypes. Representative data for 3 TCD8 specificities of 6 measured are shown. Numbers represent the percentage of p/B7.2 tetramer+ cells within TCD8 gate (top row) or the percentage of p/B7.2 tetramer+ TCD8 with indicated phenotype. (C and D) Multifunctionality of dominant and subdominant TCD8 detected in immune spleens after ex vivo restimulation with peptide. Data are representative of at least 2 independent experiments. Numbers in C represent the percentage of IFN-γ+CD107a+ cells within the TCD8 gate (top row) or the percentage of IFN-γ+CD107a+ TCD8 expressing the indicated cytokines (middle and bottom rows). Error bars in D represent mean ± SD of the assay replicates (n = 3–5). (E) Broad TCR Vβ usage within individual TCD8 specificity. Bar segments indicate the proportion of TCRβ clonotype within the indicated p/B7.2 tetramer+ TCD8 spleen cells. Note that priming with VACV proteins followed by viral challenge enhanced the 4 low-frequency TCD8. (F) Wide tissue distribution of VACV-specific TCD8. Bar segments indicate the proportion of the indicated specificity within the 10 p/B7.2 tetramer+ TCD8 measured. Data are representative of 2 independent experiments (n = 5).

