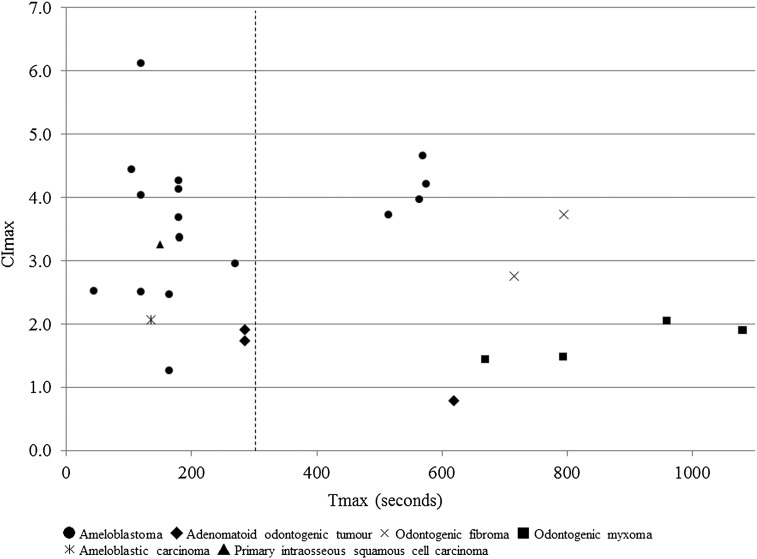
Figure 4.
The relationship between the time when the maximum contrast index (CImax) occurred (Tmax) and the CImax values of the 27 cases subjected to the dynamic contrast-enhanced MRI parameter analysis. The odontogenic tumours were divided into two groups according to their Tmax values (vertical dashed line: cutoff point).

