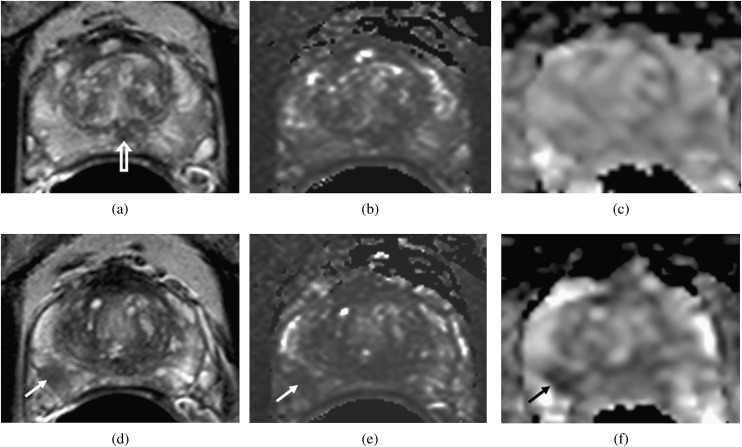
Figure 4.
Transverse slices through the prostate at the level of the verumontanum (open arrow, a) and through the tumour (d–f) in a patient with a peripheral zone fractional volume of 32%. T2 Weighted images (a, d), T2 maps (b, e) and apparent diffusion coefficient (ADC) maps (c, f) show that the peripheral zone has a relatively long T2 (148 ms) and a relatively high ADC (1707×10−6 mm2 s−1). The tumour (arrows, d–f) has a short T2 (88 ms) and shows restricted diffusion (ADC=1008×10−6 mm2 s−1).

