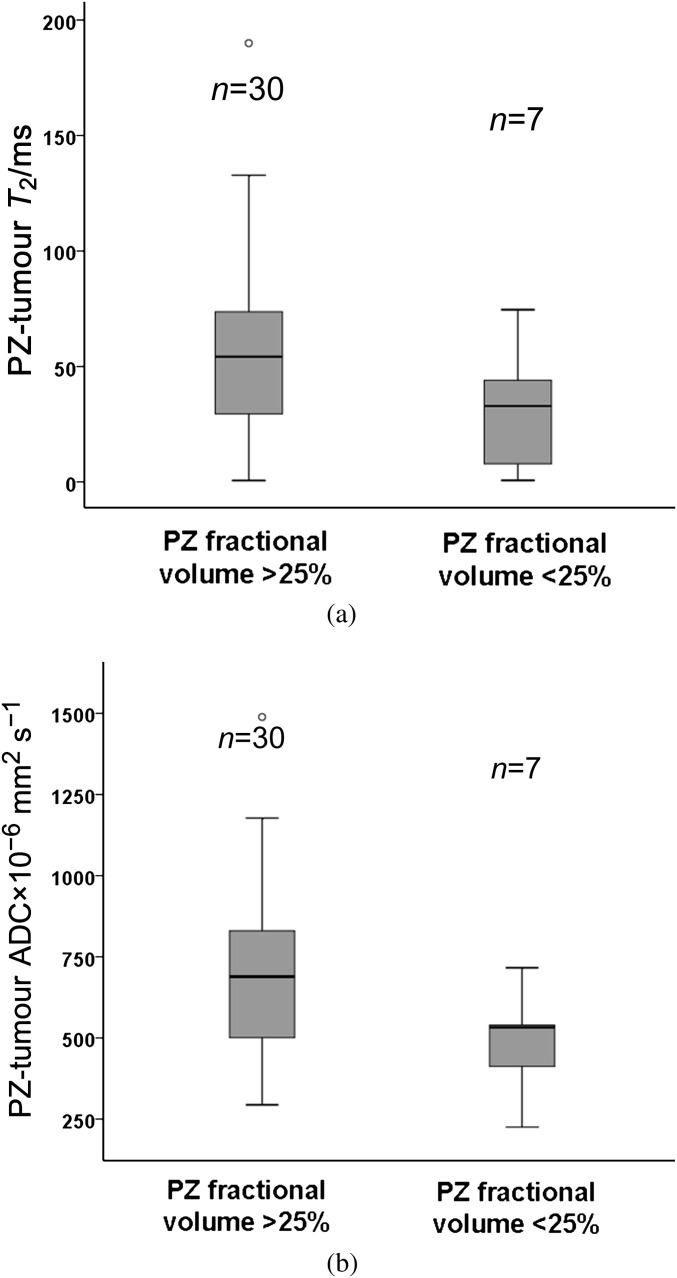
Figure 6.
Boxplot comparing the difference between peripheral zone (PZ) and tumour T2 values (a) and apparent diffusion coefficient (ADC) values (b) in patients with a PZ fractional volume (PZFV) of >25% and <25%. Central line of the box indicates median values, and the upper and lower lines, the upper and lower quartiles, respectively. Whiskers indicate maximum and minimum values. Although the trend is for lower T2 and ADC values at lower PZFV, the differences are not significant.

