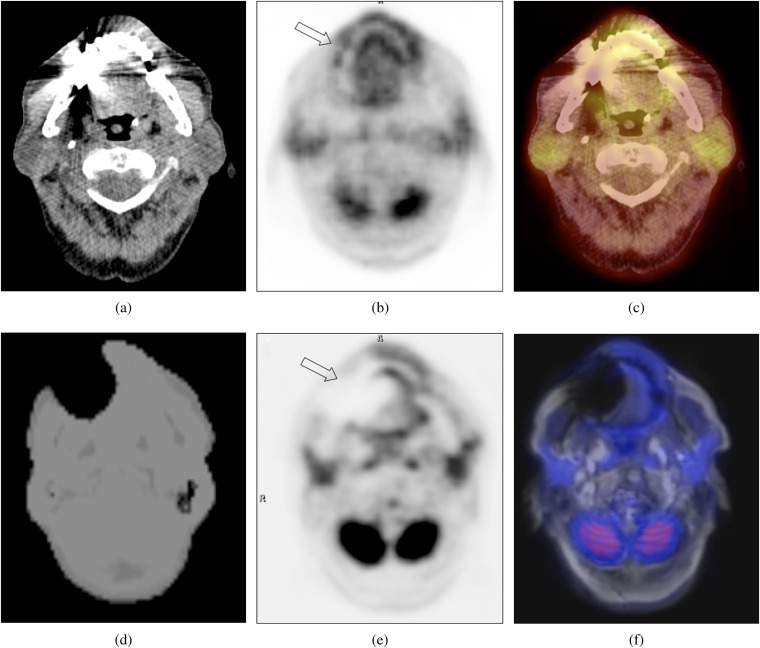
Figure 1.
Transverse CT image (a) showing a typical artefact caused by a dental implant. The corresponding CT-based attenuation-corrected positron emission tomography (PET) (b) and PET/CT (c) images show an (artificially) increased 18F-fludeoxyglucose (18F-FDG) uptake (arrow in Figure 1b) of the adjacent soft tissue. The MRI-based attenuation correction (MRAC) map of the same patient (d) shows a large region of missing data and tissue misclassification as air around the dental implants, resulting in an artificially decreased 18F-FDG uptake (arrow in Figure 1e) in the corresponding MRAC PET (e). The PET/MRI image (f) shows a severe artefact in the transverse T1 weighted sequence used for anatomical correlation.

