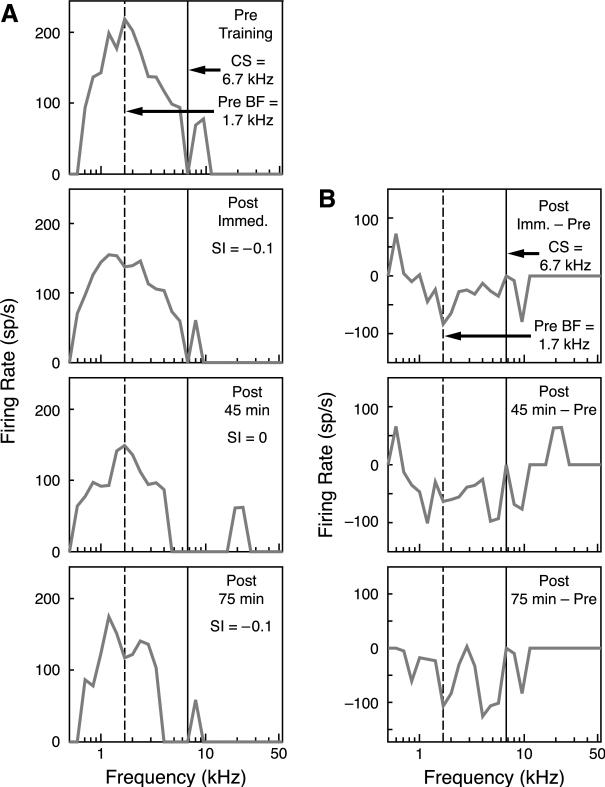
Fig. 5.
(A) Examples of tuning curves recorded from an animal in the BLA/1.6 group. Tuning Training shifts were negligible in this group. The top row is the pre-training tuning curve with a BFmax at 1.7 kHz; the chosen was 6.7 kHz. Immediately after training, there was a slight decrease in firing rate at the BFmax and a slight shift in the BFmax frequency away from the training frequency. At 45 min after training, the BFmax frequency returned to the pre-training BFmax (1.7 kHz) and the firing rate did not change. At 75 min after training, the there was a slight shift away from the training frequency again and the firing rate did not change. (B) Differences between the pre- and post-training tuning curves. At each time period, there was no clear shift in tuning away from or towards the training frequency.

