
Figure 6. Overview of the line measurement.
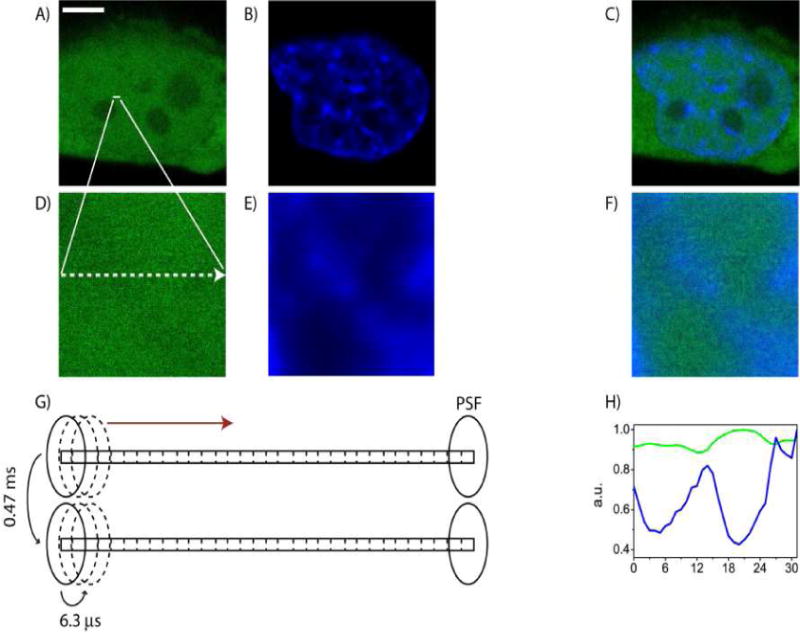
(A) Free EGFP in CHOK1 cell. Scale bar: 5μm. (B) Nucleus of CHOK1 cell stained with Hoechst 33342. (C) Merged image of A and B. (D) Free EGFP in the plane of the line drawn: 3.3μm (E) Hoechst 33342 staining in the plane of the line drawn: 3.3μm. (F) Merged image of D and E. (G) Schematic of the laser PSF traversing across a 3.2μm line (32 pixels) in the nucleus, scanning from left to right with a pixel dwell time of 6.3μs and a line time of 0.47ms. (H) Comparison of the intensity profile of EGFP and Hoechst 33342 for a line experiment.