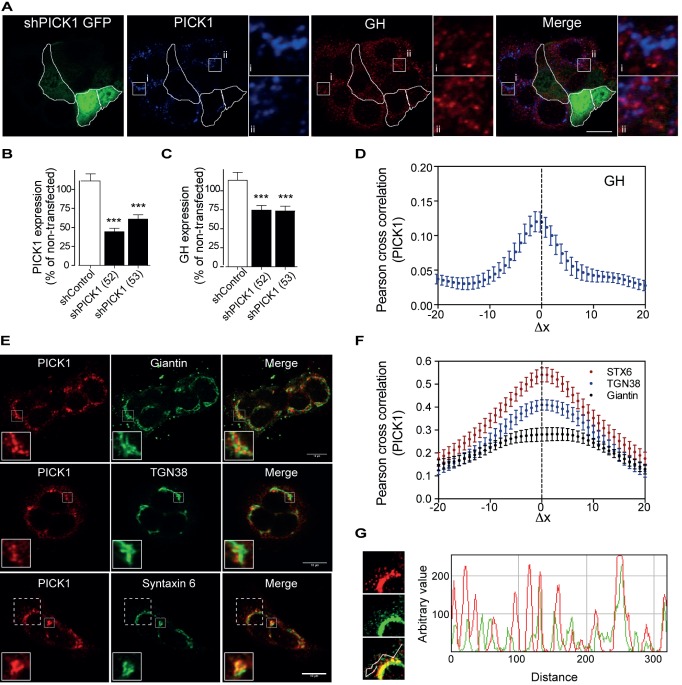
Figure 6. PICK1 is localized to vesicles exiting the Golgi in cultured GH1 cells, and knockdown of PICK1 reduces GH immunosignal in GH1 cells.
(A) PICK1 is expressed in GH-producing GH1 cells, and PICK1 knockdown reduces GH content. Confocal images of GH1 cells immunostained for PICK1 (blue) and GH (red). Cells transfected with shRNA against PICK1 are identified by obligate coexpression of green fluorescent protein (EmGFP) (green) and are outlined. Insets (squares) show area with (i) no colocalization of PICK1 and GH and (ii) partial colocalization of PICK and GH. Scale bar, 10 µm. (B and C) Quantification of PICK1 immunosignal (B) and GH immunosignal (C) in GFP-positive cells transfected with either of two different shRNAs against PICK1 (52 and 53). Data are % of signal in surrounding non-transfected cells (mean ± SE) for control shRNA (shControl) (n = 48), shPICK1 (52) (n = 69), and shPICK1 (53) (n = 75). ***p<0.001, compared to shControl, Mann–Whitney rank sum test. (D) Quantification of the PICK1 co-localization with GH using Van Steensel's cross-correlation function, which reports the Pearson cross-correlation as a function of the relative movement of the two channels with respect to each other. The low but sharp peak close to Δx = 0 indicates partial but specific co-localization. (E) Co-localization of PICK1 with Giantin, TGN38, and syntaxin 6. Confocal laser scanning micrographs of GH1 cells immunostained for endogenous PICK1 (red) and the cis-Golgi marker giantin (top), the trans-Golgi (TGN) marker TGN38 (middle), and the TGN/immature vesicle marker syntaxin 6 (bottom) (all in green). Insets highlight area where the PICK1 signal was either enclosed by, or closely associated with, the Golgi markers (giantin, top, and TGN38, middle) or partially co-localizing (syntaxin 6, bottom). (F) Quantification of PICK1 colocalization with giantin, TGN38, and syntaxin 6 using Van Steensel's cross-correlation function. The broad peak for giantin is characteristic for large adjacent structures, whereas the high and sharp peak close to Δx = 0 for syntaxin 6 indicates specific co-localization. TGN38 is intermediate between these distributions, suggesting a partial overlap of the structure with PICK1. Co-localization was quantified for 10–20 cells from three independent experiments, and data are means ± SE. (G) Dashed box (left) from (E, Bottom) with magnification and gain adjusted for visualization of the punctate staining of PICK1 (red) and syntaxin 6 (green). Intensity profile (right) through several punctae (white line in lower, merged picture on the left) shows peaks corresponding to punctae for both PICK1 and syntaxin 6. All immunocytochemistry data were obtained from at least three independent experiments, and the cells are representative of multiple cells imaged in each experiment.

