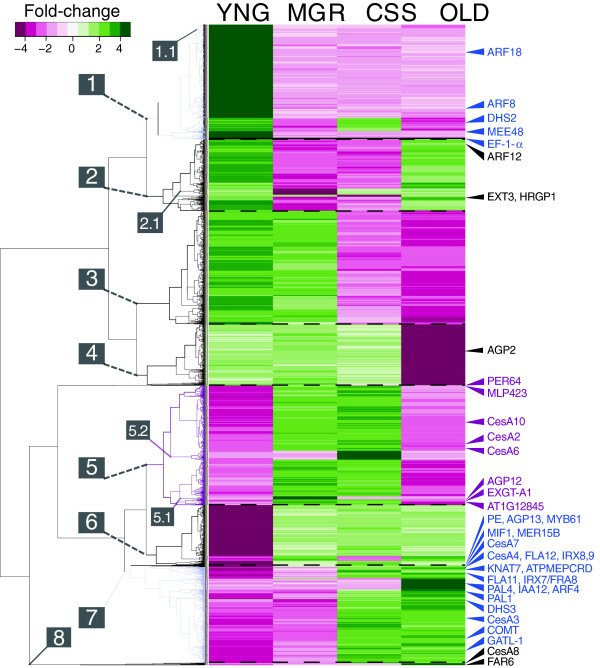
Figure 2.
Hierarchical clustering of 4635 differentially expressed genes (q-value<0.05). On the basis of relative expression between cell wall expansion stages as outlined in Figure 1; top 1 cm of plant (YNG), maximum growth-rate (MGR), cessation of elongation (CSS) and base of primary stem at rosette (OLD). Inset; 11-level colourimetric fold-change scale. Clusters (1–8) and stage-specific sub-clusters (1.1,2.1,5.1,5.2) are numbered for subsequent examination. The positions of representative genes associated with cell wall processes have been indicated along the right margin (described in ‘Results’ and/or ‘Discussion’). PE=pectin esterase, At2g45220.

