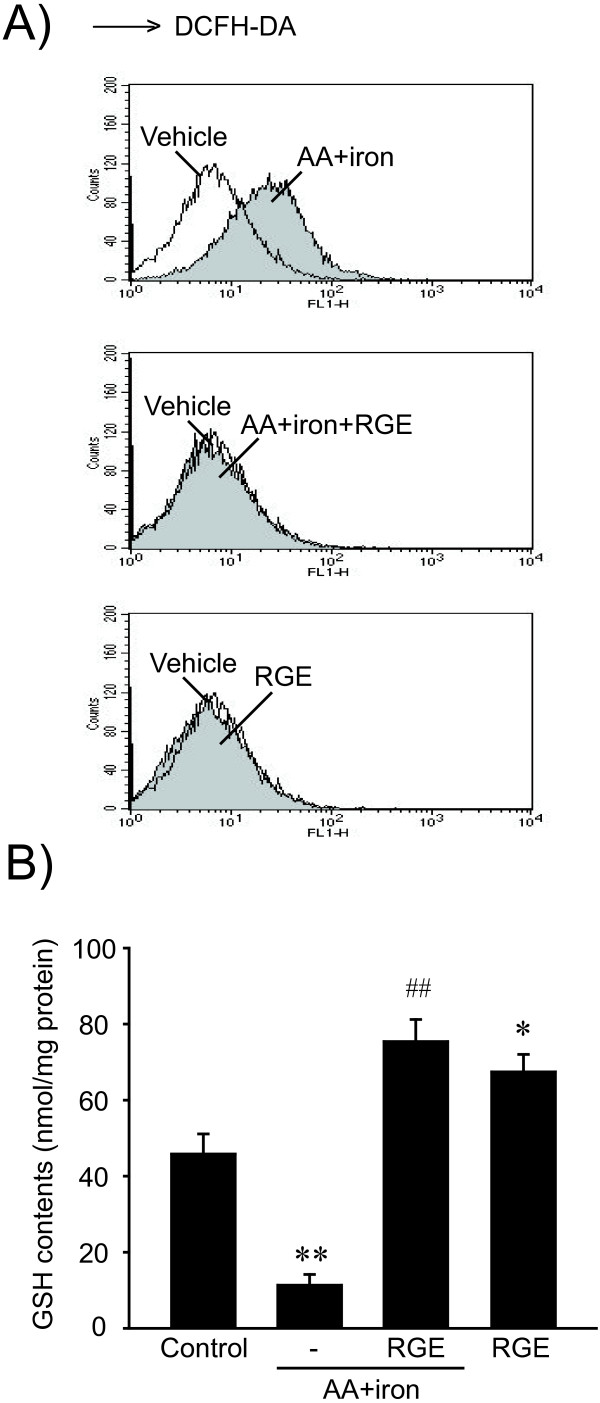
Figure 2.
The cellular antioxidant effect of RGE. A) Cellular H2O2 production. H2O2 production was monitored by measuring dichlorofluorescein (DCF) fluorescence. HepG2 cells were incubated with 1 mg/ml RGE for 1 h, followed by incubation with AA (12 h) and iron (1 h). RGE treatment attenuated AA + iron-induced ROS production. B) Cellular GSH content. The GSH content was assessed in cells that had been treated as described in the legend to Figure 1C. Data represent the mean ± S.E.M. of three separate experiments. The statistical significance of differences between treatments and either the vehicle-treated control (*p < 0.05, **p < 0.01) or cells treated with AA + iron (##p < 0.01) was determined.

