
. 2013 Apr 2;13:72. doi: 10.1186/1472-6882-13-72
Copyright © 2013 Jang et al.; licensee BioMed Central Ltd.
This is an Open Access article distributed under the terms of the Creative Commons Attribution License (http://creativecommons.org/licenses/by/2.0), which permits unrestricted use, distribution, and reproduction in any medium, provided the original work is properly cited.
Figure 1.
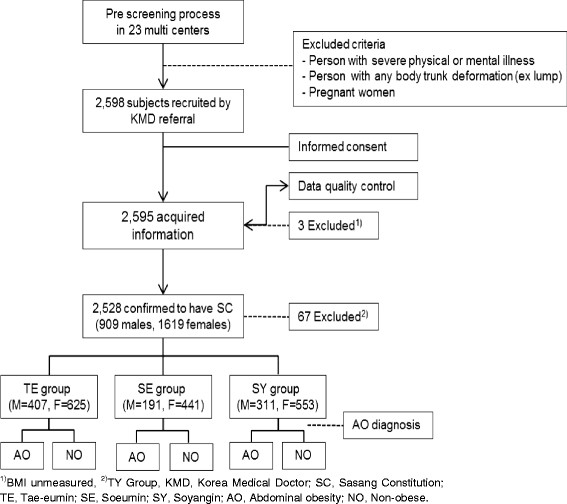
The flow chart of the study.