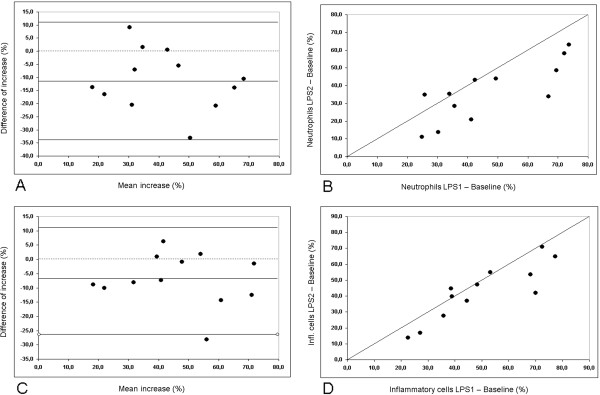
Figure 5.

Reproducibility of the low dose LPS induced inflammatory response (LPS 1 vs. LPS 2). Top row (A, B): Change in the percentage of sputum neutrophils compared with baseline. Bottom row (C, D): Change in the percentage of the sum of neutrophils, monocytes and small macrophages compared with baseline. On the left (A, C) Bland-Altman plots with lines indicating the mean and 2*SD of the differences and on the right (B, D) the respective correlations with the line of identity.
