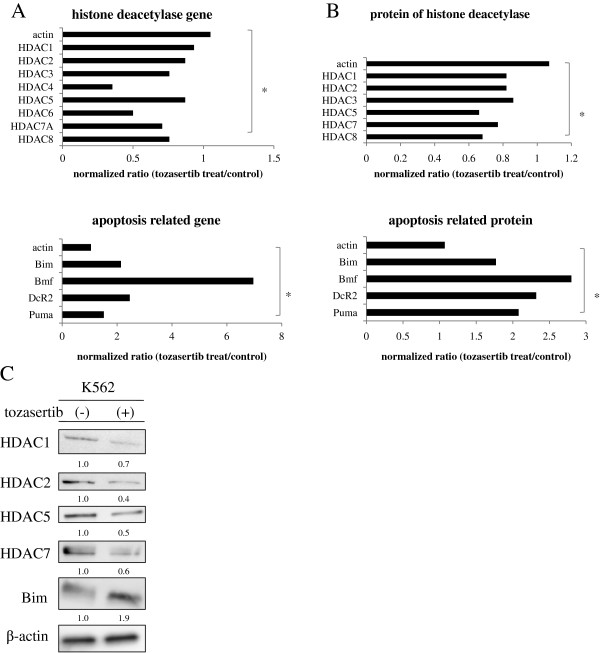
Figure 2.
Analysis of the effects of tozasertib on BCR-ABL-expressing cells. (A) K562 cells were exposed to 1 μM tozasertib or PBS (control) for 16 h. Gene expression data were validated with the Human Genome U133A Genechip. The bar graph shows the expression of HDAC and apoptosis related genes in K562 cells after tozasertib treatment versus control. * P < 0.05 for comparison to the actin expression. (B, C) An antibody expression microarray was performed as described in the Materials and Methods section. Protein expression was calculated using MS Excel. Prior to immunoblotting, K562 cells were treated with tozasertib for 24 h. Total extracts were analyzed using anti-HDAC1, -2, -5, -7, and -Bim Abs. Actin was used as the loading control. Band intensities were quantified using ImageJ software. Results in A, B, and C are representative of 3 different experiments. * P < 0.05 for comparison to the actin expression.

