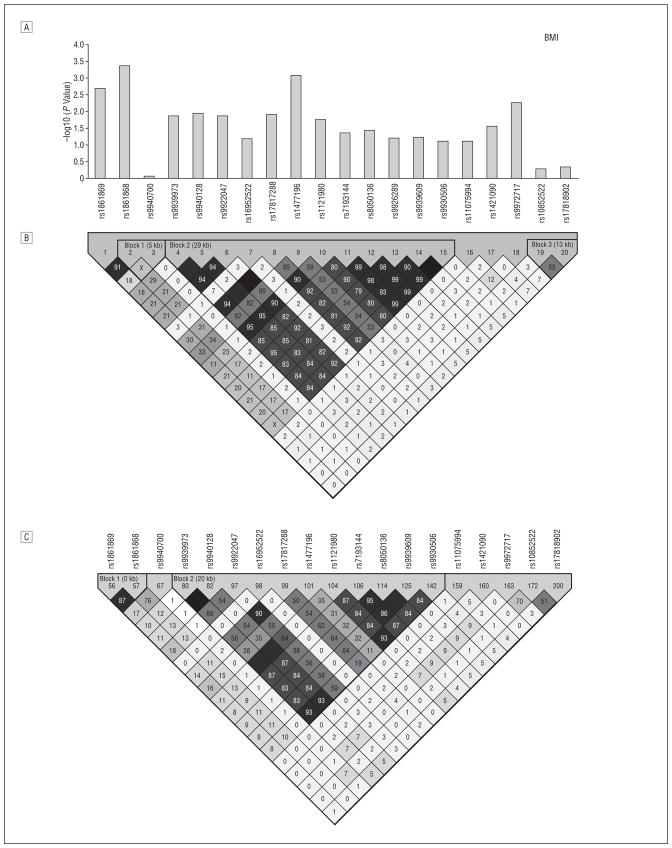
Figure 1.
Linkage disequilibrium (LD) structure and FTO single-nucleotide polymorphism (SNP) associations with body mass index (BMI). A, For each SNP surrounding rs9939609, we show –log10 (P value) for the additive model in the Old Order Amish (OOA). B, The LD (r 2) of FTO in OOA white subjects. C, The LD (r 2) of FTO in the HapMap (http://www.hapmap.org) genotype of white individuals. The association of rs9939609 with BMI was first reported in European white individuals1 and subsequently in French white individuals2; rs9930506 was the SNP most highly associated with BMI in a Sardinian population3; rs8050136 was associated with type 2 diabetes mellitus (T2DM) in European white subjects.11-13 Zeggini et al13 later found that the association disappeared after adjustment for BMI. In an independent sample of 419 OOA subjects (of whom 124 had T2DM), rs8050136 was associated with T2DM (P = .007), and this association was abolished after adjustment for BMI (P = .53) (data not shown). rs9939609, rs9930506, and rs8050136 all reside in a cluster of SNPs in high LD in HapMap genotypes of white individuals. Black squares indicate r 2>0.80; gray squares, 0.10 ≥r2≤0.80; white squares, r2<0.10. kb Indicates kilobases.

