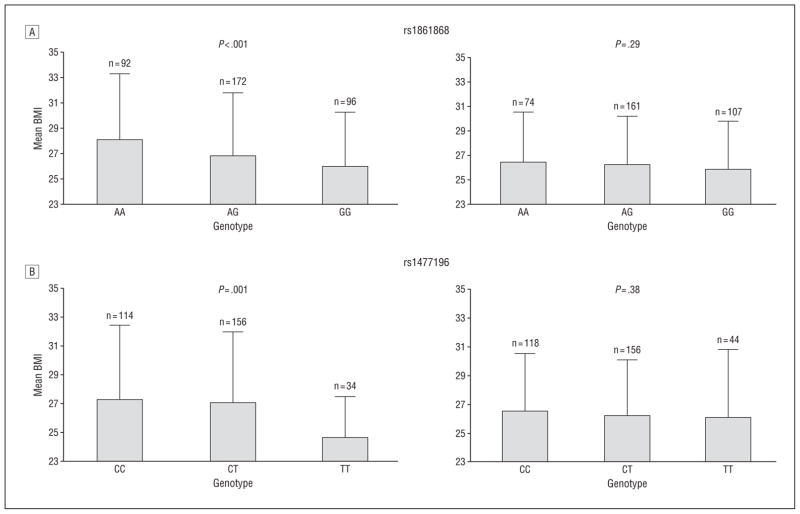
Figure 2.
Mean body mass index (BMI), calculated as weight in kilograms divided by height in meters squared, in high and low physical activity groups according to FTO single-nucleotide polymorphism genotypes for rs1861868 (A) and rs1477196 (B). High activity was defined as age-, age2-, and sex-specific residuals greater than 0, and low activity was defined by residuals less than 0. Interaction P values: rs1861868, P = .01; rs1477196, P = .004.

