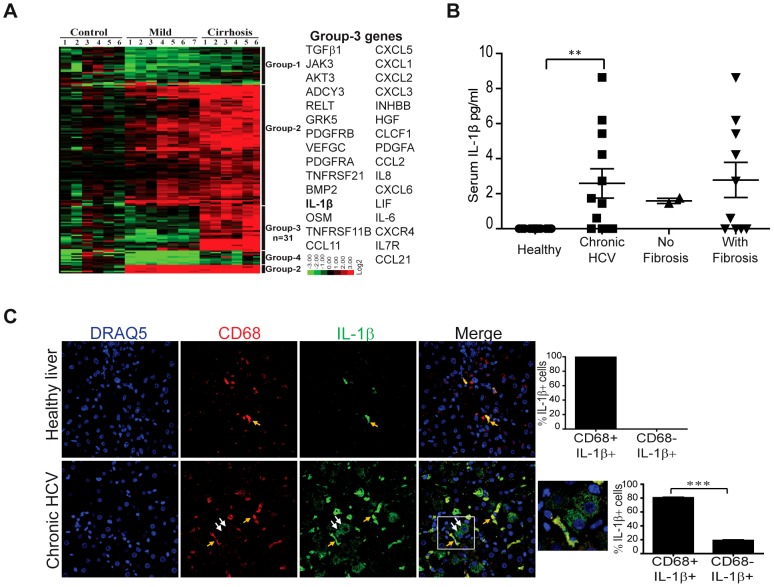
Figure 1. IL-1β associates with hepatic disease and is produced by liver macrophages in chronic hepatitis C patients.
(A) Hierarchical clustering of differentially expressed genes as determined by RNA-seq analysis of liver specimens from control or HCV patients with mild (no fibrosis) and severe (cirrhosis) liver disease. Clustering analysis of a total of 158 differentially expressed genes (>1.5-fold change and FDR, 0.05) in the cytokine-cytokine receptor and chemokine signaling pathways is shown. The expression of group-3 genes were increased only in patients with severe liver disease; Group-3 genes and the expression key are shown at the right (for full description, see Table S1). For analysis see methods. (B) IL-1β levels from sera of chronic hepatitis C patients and healthy controls. (C) Immunohistochemical staining and confocal microscopy analysis of healthy liver and chronic hepatitis C patient liver samples. CD68 marks macrophages (Kupffer cells or infiltrating macrophages) (red), IL-1β (green), and DRAQ5 (blue) stains the nuclei. A quantification plot of CD68+IL-1β+ cells and CD68+IL-1β - of the total IL-1β+ cells is depicted from chronically infected (three patients,) and normal healthy liver samples. The area within the white box of the far right merged panel is enlarged and shown with cell frequency counts at right. **P = 0.0062 and ***p<0.0001 by student's t-test. Arrows (white) indicate hepatocytes adjacent to CD68+/IL-1β+ Kupffer cells (yellow arrows).

