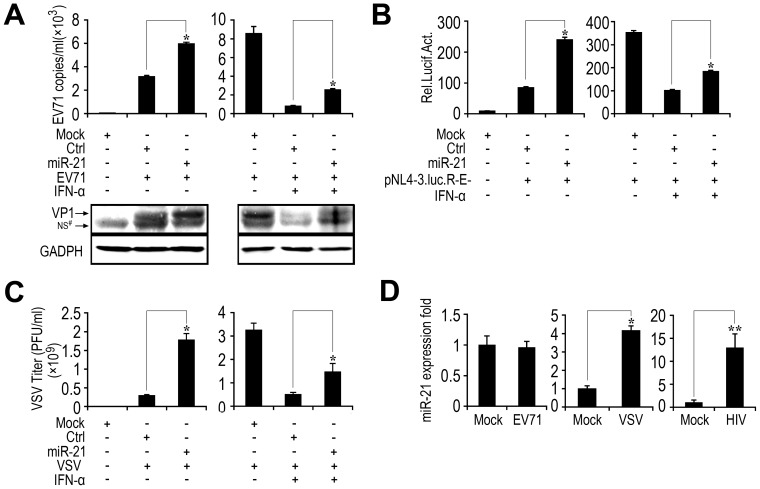
Figure 11. Effects of other viruses on the regulation of miR-21 expression.
(A) RD cells were transfected with miR-21 mimics or control RNA (final concentration, 50 nM) and further treated with or without IFN-α (100 U/ml) 24 h later. Thirty-six hours after transfection, the cells were infected with EV71 (MOI = 1) for 2 h and then washed. Cells were harvested at 12 h post-infection. EV71 RNA levels were quantified by qPCR (upper panel), and the viral VP1 protein expression was measured by Western blot (lower panel). (B) PBMCs were co-transfected with pNL4-3.luc.R-E- and miR-21 mimics or control RNA (final concentration, 50 nM) for 24 h and treated with or without IFN-α (100 U/ml). Luciferase activity was then measured. (C) Huh7 cells were transfected with miRNA or control RNA as indicated (final concentration, 50 nM). After 24 h, cells were infected with VSV (MOI = 1) for 2 h and washed before treatment with or without IFN-α (100 U/ml). Supernatants were harvested at 24 h post-infection and analyzed for VSV production using standard plaque assays. (D) VSV and HIV, but not EV71 induced miR-21 expression. RD cells were infected with EV71 (MOI = 1) for 6 h. Huh7 cells were infected with VSV (MOI = 1) for 6 h. PBMCs were transfected with pNL-luc-E-R+ plasmids for 48 h. miR-21 expression was determined by qPCR. Experiments were performed three times with similar results. All graphs represent means ± SD, n = 3. **, p<0.01; *, p<0.05.

