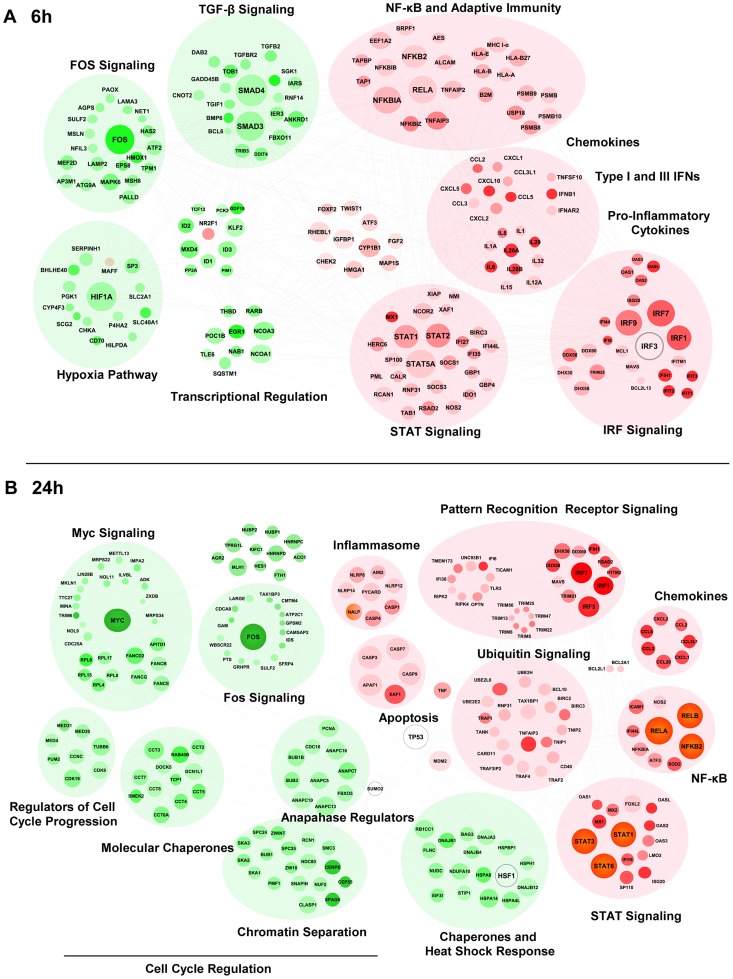
Figure 4. Functional characterization of genes differentially expressed by RIG-I.
The 6 h (A) and 24 h (B) time points from the kinetic analysis were selected to perform a functional classification of the up-regulated (red) and down-regulated (green) genes by 5′pppRNA. Genes with a fold change ≥±2 and p-value ≤0.001 were clustered using IPA. The intensity of the color is representative of the fold change. Larger circles indicate a transcription factor.

