
Figure 3.
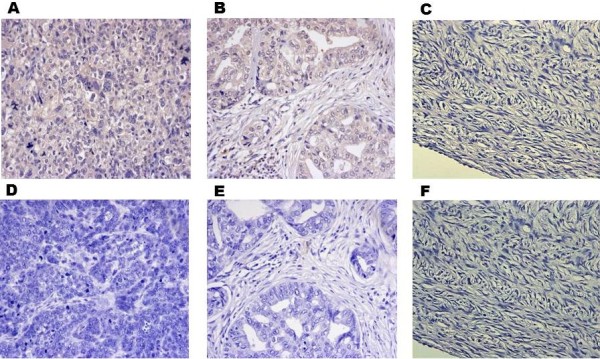
IHC analysis of CD44v6 expression in tumor tissues on an Ovarian Cancer Tissue Chip. Representative IHC staining images of grade 3 ovarian serous adenocarcinoma (A) and corresponding negative control (D), grade 2 lymph node metastatic serous adenocarcinoma (B) and corresponding negative control (E), and edge tissues of normal ovary (C) and corresponding negative control (F).