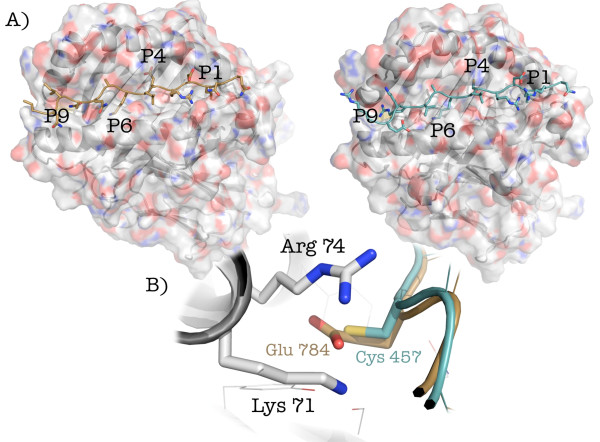
Figure 2.
Modeling of the interaction between HLA-DRB1*03:01, SLA/LP452-465, and PS 120790-804. A) The crystal structure of HLA-DRB1*03:01 is represented as ribbons and transparent surface, with carbon atoms colored in light grey, oxygen in red, nitrogen in blue and sulfur in yellow. SLA/LP452-465 (peptide “A”) and PS 120790-804 (peptide “B”) are depicted as cyan and brown sticks, respectively. The location of anchoring pockets P1, P4, P6 and P9 is also indicated. B) Detail of the P4 binding cleft. This figure was rendered with PyMOL [35].

