
Figure 4.
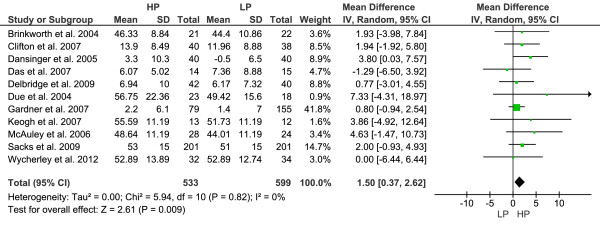
Forest plot showing pooled WMD with 95% CI for HDL-cholesterol (mg/dl) for 10 randomized controlled high-protein diet studies (excluding T2D subjects). For each high-protein study, the shaded square represents the point estimate of the intervention effect. The horizontal line joins the lower and upper limits of the 95% CI of these effects. The area of the shaded square reflects the relative weight of the study in the respective meta-analysis. The diamond at the bottom of the graph represents the pooled WMD with the 95% CI for the 10 study groups. Abbreviations: HP = high-protein; LP = low-protein; I2 = Inconsistency; T2D = type 2 diabetes.