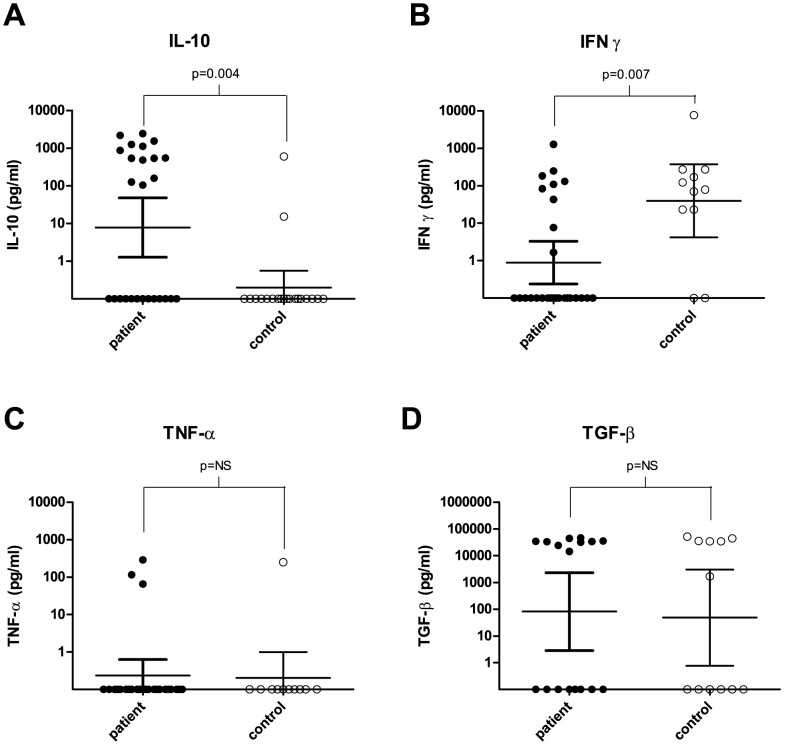
Figure 1. Cytokine concentrations of stimulated PBMCs of eumycetoma patients and healthy controls.
(A) IL-10 concentrations (pg/ml) measured after stimulating PBMCs from eumycetoma patients and healthy endemic controls with M. mycetomatis antigen. Statistically significantly different concentrations were found between eumycetoma patients and healthy controls (p = 0.004) as determined by the Mann–Whitney U test. (B) IFN-γ concentrations (pg/ml) measured after stimulating PBMCs from eumycetoma patients and healthy endemic controls with M. mycetomatis antigen. Statistically significantly different concentrations were found between eumycetoma patients and healthy controls (p = 0.007) as determined by the Mann–Whitney U test. (C) TNF-α concentrations (pg/ml) measured after stimulating PBMCs from eumycetoma patients and healthy endemic controls with M. mycetomatis antigen. No statistically significantly different concentrations were found between eumycetoma patients and healthy controls (p = 0.85) as determined by the Mann–Whitney U test. (D) TGF-β concentrations (pg/ml) measured after stimulating PBMCs from eumycetoma patients and healthy endemic controls with M. mycetomatis antigen. No statistically significantly different concentrations were found between eumycetoma patients and healthy controls (p = 0.89) as determined by the Mann–Whitney U test.

