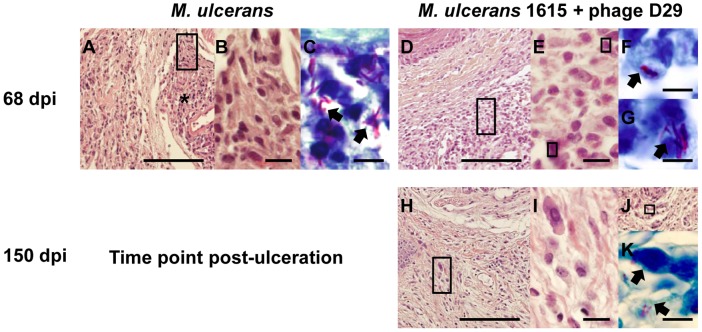
Figure 4. Histology of mice footpads of non-treated mice or mycobacteriophage D29-treated mice.
Histological sections of footpads collected at different time points were stained with HE (A, B, D, E, H, I and J) or with ZN (C, F, G and K). For panels A, D, H and J, the scale bars represent 100 µm. For panels B, E and I, the scale bars represent 10 µm. For panels C, F, G and K the scale bars represent 5 µm. dpi, days post-infection. At 68 days post-infection (A–C), footpads of non-treated mice show necrotic areas (asterisks). Magnifications of panel A (rectangles) show mononuclear cells adjacent/in necrotic areas (B). Panel C show bacteria in necrotic areas (C; arrowheads). At day 35 after treatment (day 68 post-infection) (D–G), footpads of mycobacteriophage D29-treated mice show abundant cellular infiltration (D), composed mainly by mononuclear cells (E). Staining for bacteria in the same tissue areas and magnifications of the bacilli (arrowheads) are shown in panels F and G. At 150 days after treatment (H–K), footpads of mycobacteriophage D29-treated mice show a persistent inflammatory infiltrate (H–I). Staining for bacteria in remaining necrotic areas (J) are shown in panel K.

