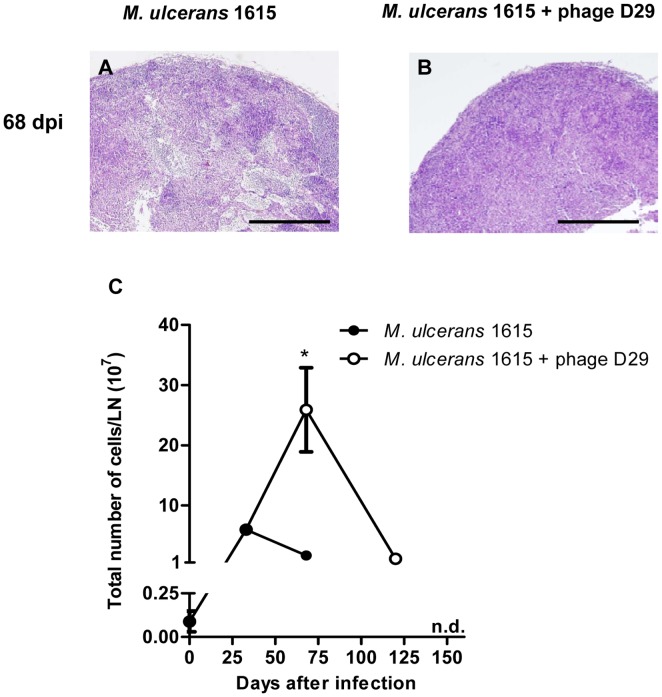
Figure 5. Histology and leukocyte kinetics in DLN of non-treated mice or mycobacteriophage D29-treated mice.
Histological sections of DLN collected at different time points were stained with HE. For panels A and B the scale bars represent 500 µm. At 68 days post-infection DLN of non-treated mice show severe damage of the lymphoid tissue (panel A). At day 35 after treatment (day 68 post-infection), DLN structure of mycobacteriophage D29 treated animals was maintained (panel B). Total number of cells in the DLN was determined in DLN suspensions (panel C). Results are from one representative experiment of two independent experiments. n.d., not determined. In panel C data points represent the mean ± SD (n = 5). Significant differences between treated and non-treated mice were performed using Student's t test (*, p≤0.05).

