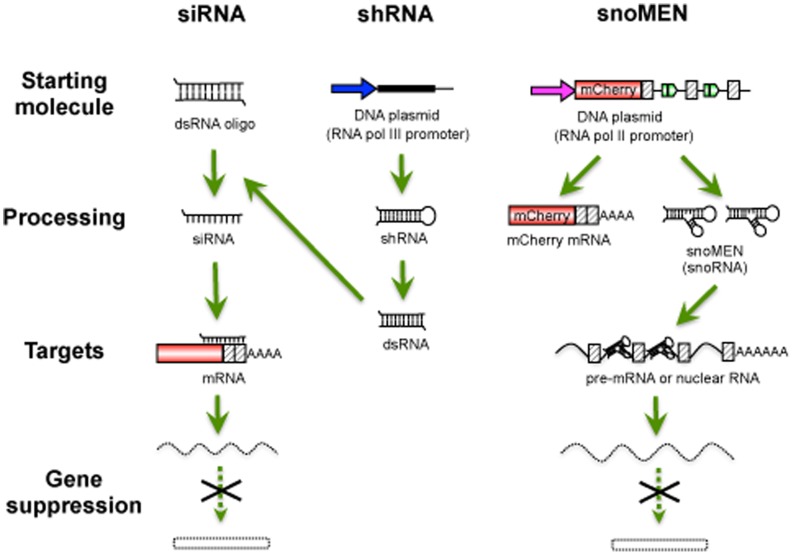
Figure 6. Features of snoMEN technology.
Schematic diagram showing differences between the siRNA/shRNA and snoMEN systems. Arrows show promoters for RNA polymerase III (shRNA) and RNA polymerase II (snoMEN), respectively. Red squares show the coding region, e.g. either mCherry cDNA, or endogenous genes. Striped squares show non-coding exon region. The bars show non-coding regions, e.g. introns.

