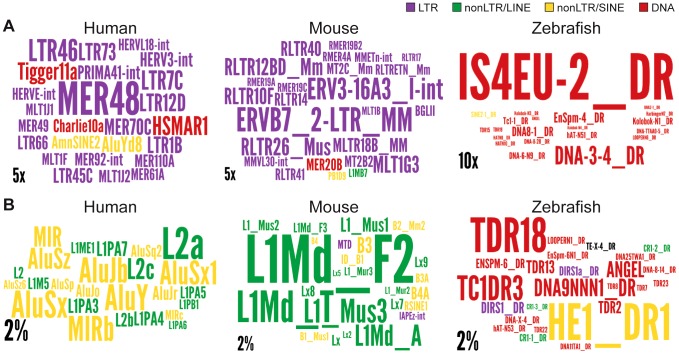
Figure 7. Wordle representation of the most enriched TE families in lncRNAs.
Colors refer to different TE classes: purple = LTR, green = LINE, yellow = SINE, red = DNA. A. See also Figure S4. Human lncRNA set is from Gencode v13, mouse is from Esembl. The expected and observed counts of fragments corresponding to each TE are calculated using RepeatMasker output (see Methods). Observed values are obtained by considering overlapping TEs lncRNA exons. Expected values are calculated based on the overall density of each TE family in the genome according to the RepeatMasker output assuming a random distribution of TE family members throughout the genome.). Only families statistically enriched in term of counts (fragment numbers) are kept (at least p-value<0.05, binomial distribution test) and only ratios above 2 are represented on wordle. For human sets, TEs with less than 5 fragments in lncRNAs are removed, 4 fragments for mouse and zebrafish. Size of the TE family name is proportional to its over-representation (scales of 5× or 10× are represented). B. Visual representation of the 25 most abundant TE families in the 3 species. Size of the TE family name is proportional to its percentage of TE derived DNA in the genome (scale of 2% is represented).

