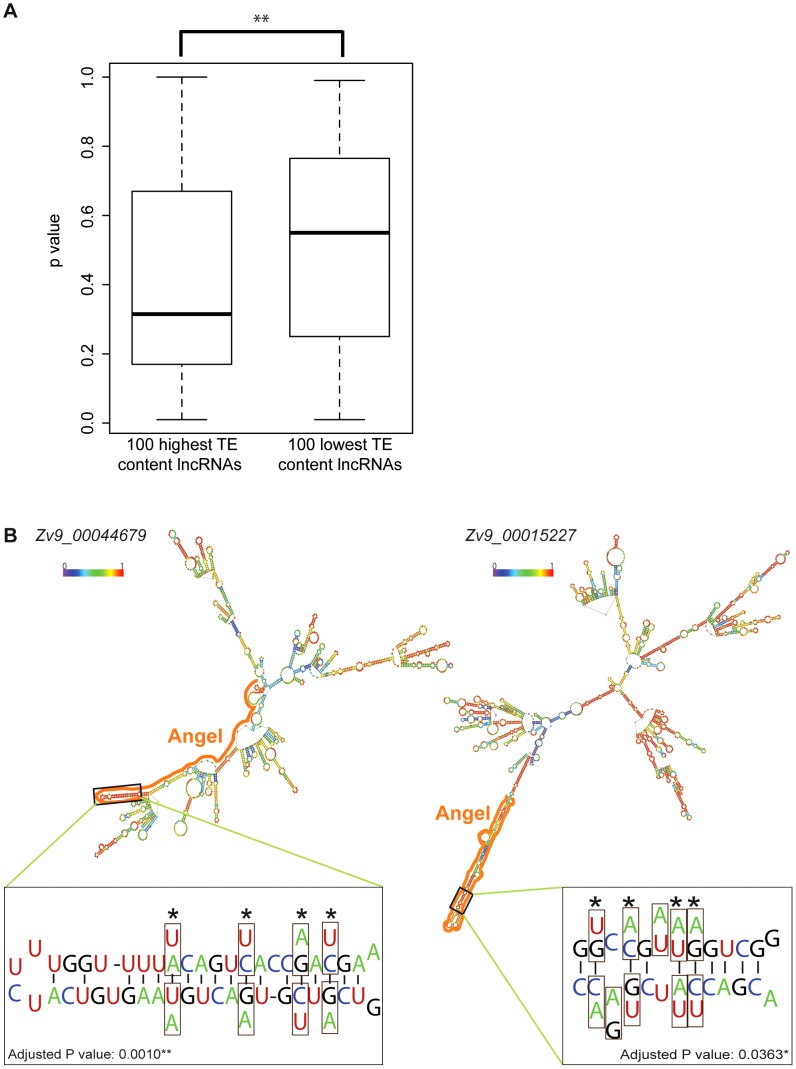
Figure 10. TE contribution to predicted lncRNA secondary structures.
A. High and low TE content groups of 100 lncRNA were extracted from Gencode v13 set (TE content from 96.74% to 100% and from 0.49% to 2.27% respectively; see Table S7). P-values were calculated by Randfold and provide an indication of predicted secondary structure stability. The boxplot depicts the maximum, upper quantile, median, lower quantile and minimum value in a standard way. The mean of these 2 groups are significantly different by Wilcox rank sum test (p = 0.0022). B. Predicted secondary structures (RNAfold [115]) and compensatory mutations for two zebrafish lncRNAs containing ANGEL (DNA TEs) elements. In structures, TE derived regions are marked by solid line and base pairing probability by color spectrum (from 0 in violet to 1 in red). Zoom-in windows show part of stem with compensatory mutations: nucleotide substitution are boxed and the corresponding nucleotide found in ANGEL consensus are shown under/above actual RNA sequence. Sites of compensatory mutations are marked by asterisks and written p-values are adjusted by Bonferroni methods.

