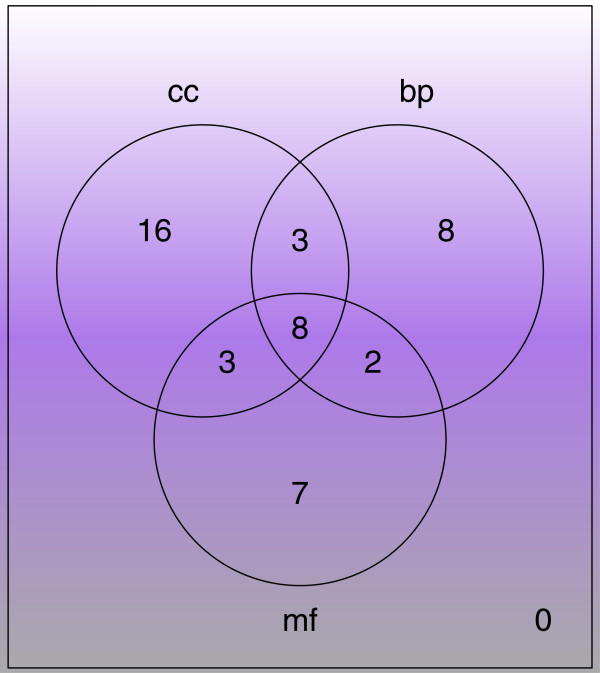
Figure 4.
Overlaps between significant complexes identified via lipid-associated GO BP, CC and MF terms. The overlaps between significant lipid-associated clusters identified via lipid-associated GO BP, CC and MF terms are expressed as a venn diagram. For all 3 categories, about at least half of the complexes are shared between two categories

