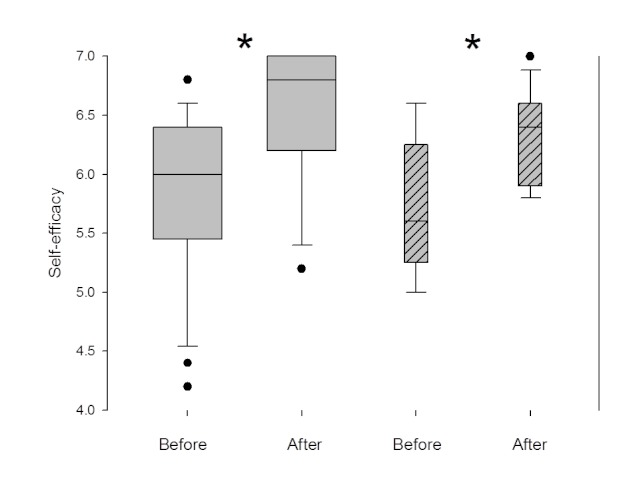
Figure 4.

Self-efficacy in the study group. The two left-most boxes present self-efficacy before and after training (N = 36).The two right-most boxes (striped) refer to the second session during the Swedish part of the study (n = 12). The box-blot illustrates 25th and 75th percentiles with median value as a solid line inside the plot and whiskers showing 10th and 90th percentiles (outliers marked outside this). Significance (P <.05) between the measurements is denoted with an asterisk (*).
