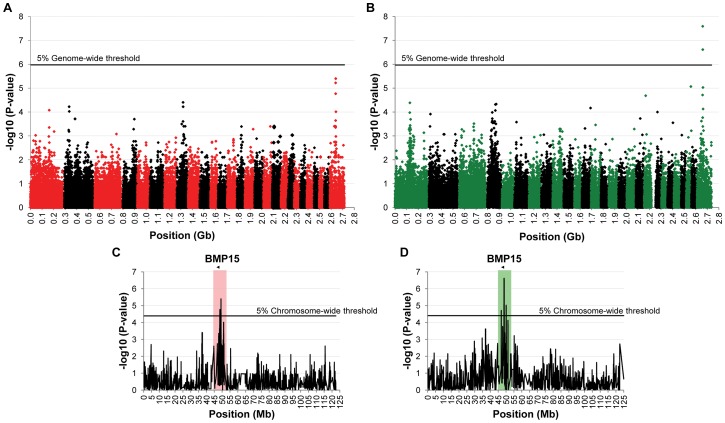
Figure 1. Genome-wide and chromosome-wide association results.
(A) Genome-wide association results for litter size in the French Grivette sheep population. (B) Genome-wide association results for ovulation rate in the Polish Olkuska sheep population. Manhattan plots show the combined association signals (−log10(p)) on the y-axis versus SNPs position in the sheep genome on the x-axis and ordered by chromosome number (OARv2.0 available on http://www.livestockgenomics.csiro.au/sheep/ website). Black lines represent the 5% genome-wide threshold. Chromosomes are ordered from OAR1 to OAR26 and the X chromosome is the last one. (C) OARX chromosome-wide association results for litter size in the French Grivette sheep population. (D) OARX chromosome-wide association results for ovulation rate in the Polish Olkuska sheep population. Manhattan plots show the combined association signals (−log10(p)) on the y-axis versus SNPs position on the X chromosome (OARv2.0 available on http://www.livestockgenomics.csiro.au/sheep/ website). Black lines represent the 5% chromosome-wide threshold. Red and green boxes pinpoint locus where significant association results are obtained for several markers in the Grivette and Olkuska populations, respectively. The location of the BMP15 gene is mentioned by an arrow.

