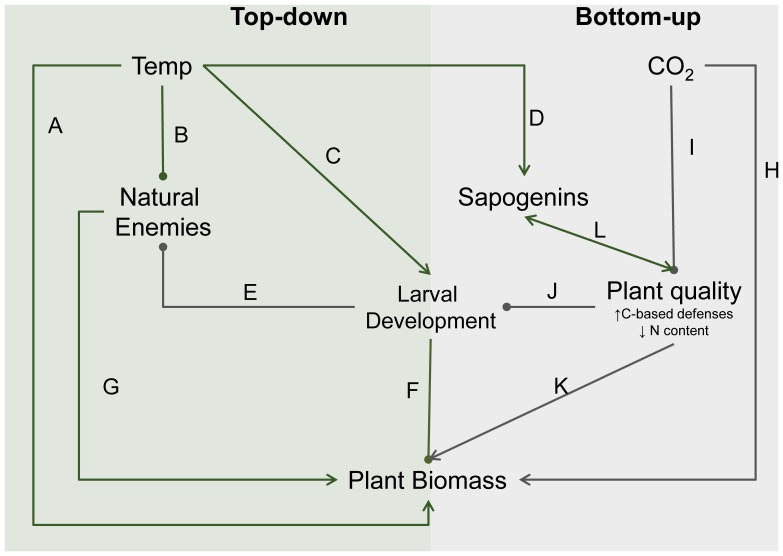
Figure 1. Path diagram summarizing direct and indirect effects of increased temperature and CO2 on tritrophic interactions.
The letters included as path coefficients correspond to direct effects that have been quantified in previous studies (cited in Table 1). Positive effects between variables are indicated by an arrow and negative effects are indicated by a filled circle. Temperature effects on top-down dominated interactions are in green and CO2 effects on chemically mediated interactions are in grey.

