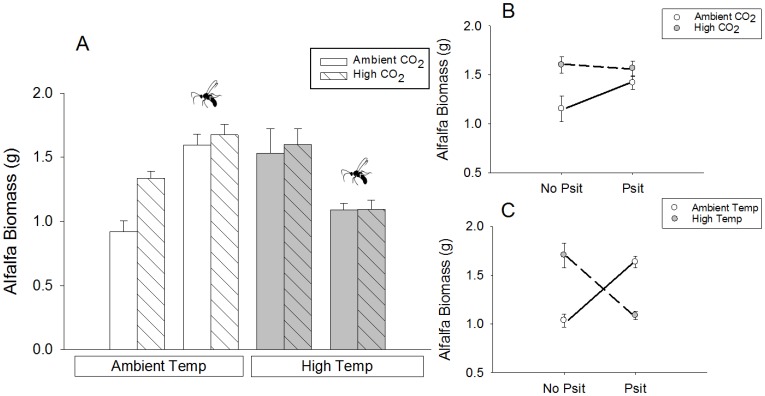
Figure 3. Alfalfa biomass with herbivores under ambient and elevated temperatures and CO2.
(A) Mean alfalfa biomass (±1 SE) under different treatments; the wasp icon indicates the parasitoid addition treatments. There was a significant effect of CO2 on alfalfa biomass; F1,195 = 10.30, P<0.01. (B) The interaction between CO2 and parasitoid treatment (Psit); F1,195 = 8.02, P<0.01. (C) The interaction between temperature and parasitoid treatment; F1,195 = 51.57, P<0.001.

