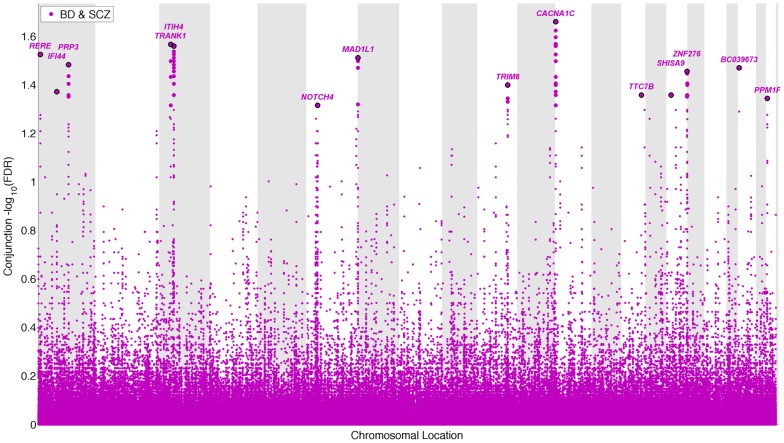
Figure 4. “Conjunction Manhattan plot” of conjunction −log10 (FDR) values for schizophrenia (SCZ) and bipolar disorder (BD).
SNPs with −log10 (FDR)>1.3, (i.e. FDR<0.05) for both SCZ and BD are shown with large points. A black line around the large points indicates the most significant SNP in each LD block and this SNP was annotated with the closest gene, which is listed above the symbols in each chromosome. The figure shows the localization of the ‘pleiotropic loci’, and further details are provided in Table 3.

