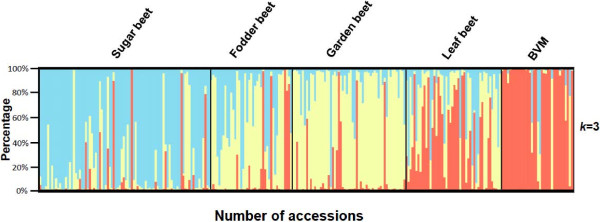
Figure 2.

Overview of population structure analysis. Population structure of 268 B. vulgaris accessions based on 40 AFLP markers under the assumption of k = 3 subpopulations. Each B. vulgaris accession is represented by one bar that is divided in up to k segments, each proportional to the inferred subpopulation. Accessions are grouped by their respective B. vulgaris group. BVM = B. vulgaris ssp. maritima.
