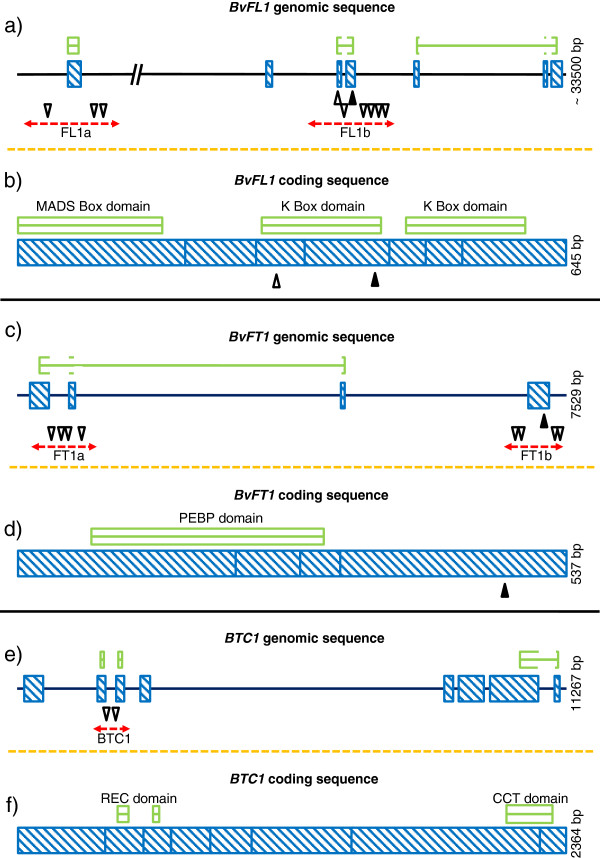
Figure 3.
Flowering time genes BvFL1,BvFT1 and BTC1 and distribution of polymorphisms. Shown are graphical outputs from PARSESNP. a), c), e) Genomic sequences with intron/exon structure. b), d), f) Coding sequences. Red dotted arrowed lines indicate the amplicons investigated by EcoTILLING. Blue striped boxes indicate exons. White arrowheads that point downwards indicate changes in non-coding regions. Black arrowheads that point upwards indicate changes that induce missense mutations in the protein products. White arrowheads that point upwards indicate silent changes. Green boxes mark important protein domains.

