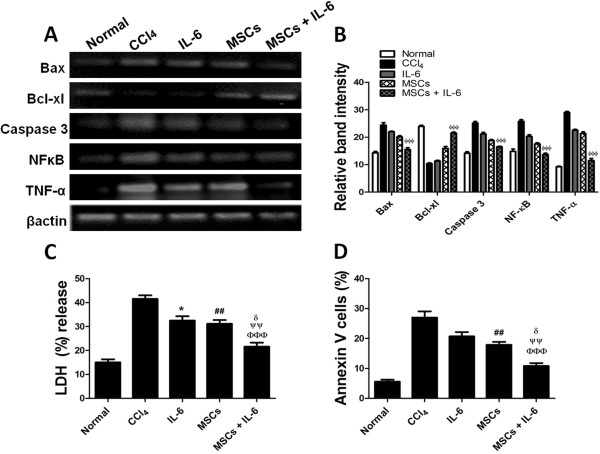
Figure 2.
Enhanced hepatocyte survival after co-culture with MSCs + IL-6. A) Gene expression of apoptotic (Bax, caspase-3, NF-κB, TNF-α) and anti-apoptotic (Bcl-xl) markers in hepatocytes co-cultured with MSCs together with IL-6. B) Gel band quantification of gene expressions through Image J (n=3). CCl4 vs MSCs + IL-6 ɸ p< 0.05, ɸ ɸ p< 0.01 and ɸ ɸ ɸ p< 0.001. C) LDH (%) release levels in control and treatment groups (n=4). D) Analysis of apoptotic cells through annexin V staining (n=4). CCl4 vs IL-6 *p< 0.05, **p< 0.01 and ***p< 0.001, CCl4 vs MSCs #p< 0.05, ##p< 0.01 and ###p< 0.001, CCl4 vs MSCs + IL-6 ɸ p< 0.05, ɸ ɸ p< 0.01 and ɸ ɸ ɸ p< 0.001, IL-6 vs MSCs + IL-6 ψp< 0.05, ψψp< 0.01 and ψψψp< 0.001, MSCs vs MSCs + IL-6 δp< 0.05, δδp< 0.01 and δδδp< 0.001.

