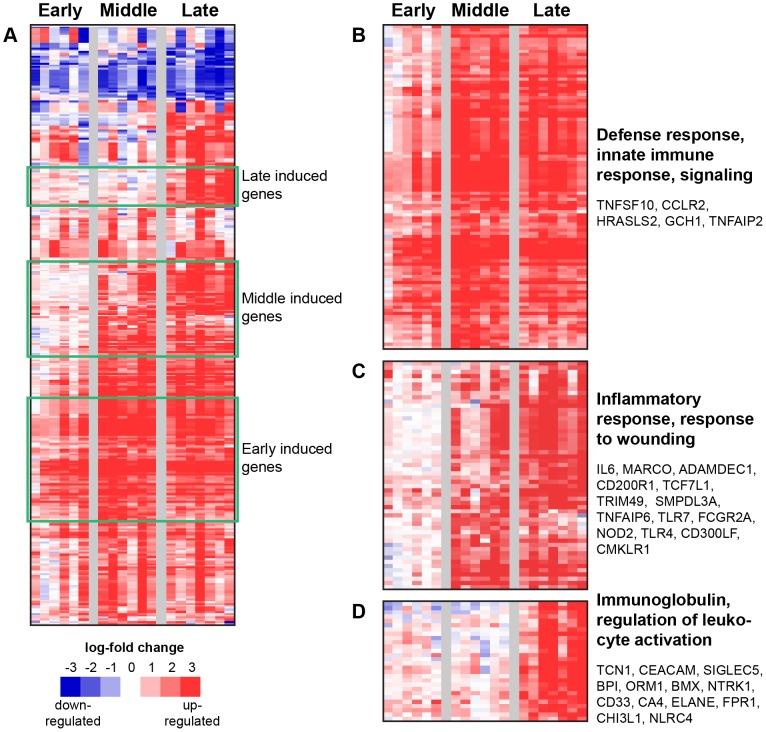
Figure 2. Strongly upregulated genes in LASV-exposed NHP.
(A) Data had been zero-transformed using the pre-exposure control sample from each individual monkey to normalize for animal-intrinsic signatures and establish a baseline. Data were then filtered to identify 361 genes that showed at least a 2.5 log2-fold differential expression, and then hierarchically clustered. Each row in the heatmaps represents data from an individual gene, and each column represents the individual PBMC sample taken at a specific time point. Samples from the dataset were grouped into early (days 2–3), middle (days 6–8) and late (days 10–12) disease categories based on the day the sample was collected post-viral challenge. Red and blue colors denote expression levels greater or less than baseline (white), respectively. Green boxes identify significant clusters of genes induced during early, middle, and late disease, and are labeled accordingly. An expanded view of these gene clusters is shown in (B), (C), and (D). The most significant functional groups (assigned by DAVID, p-value<0.001) found in the respective clusters are listed to the right of the heatmaps, along with the names of some representative genes.

