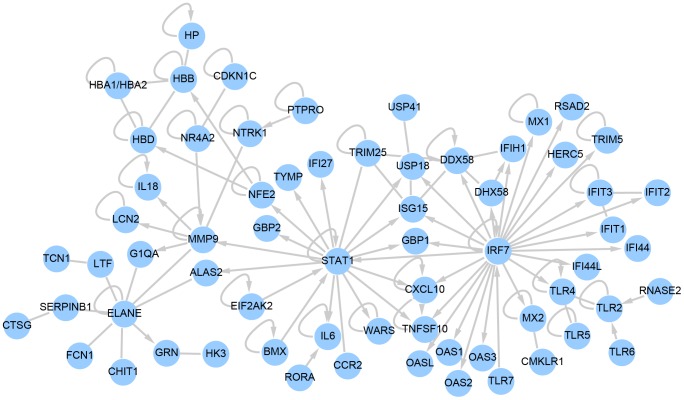
Figure 3. A signaling networks of 65 genes which are strongly upregulated following LASV challenge of NHP.
Ingenuity Pathway Analysis software was used to analyze a list of 360 genes which were found to be strongly upregulated following LASV challenge. Of this list, 65 were found to be directly or indirectly connected according to Ingenuity's database of published interactions. Nodes represent individual gene products, with official gene symbols included. Edges without arrows indicate a direct interaction between two gene products, e.g. a protein-protein interaction. Edges with arrows represent a regulation of transcription, directed from the gene regulator to a regulated gene. Loops indicate self-regulation. Notable in the expression profiles is the upregulation of STAT1 and IRF7, MMP9 and ELANE signaling nodes.

