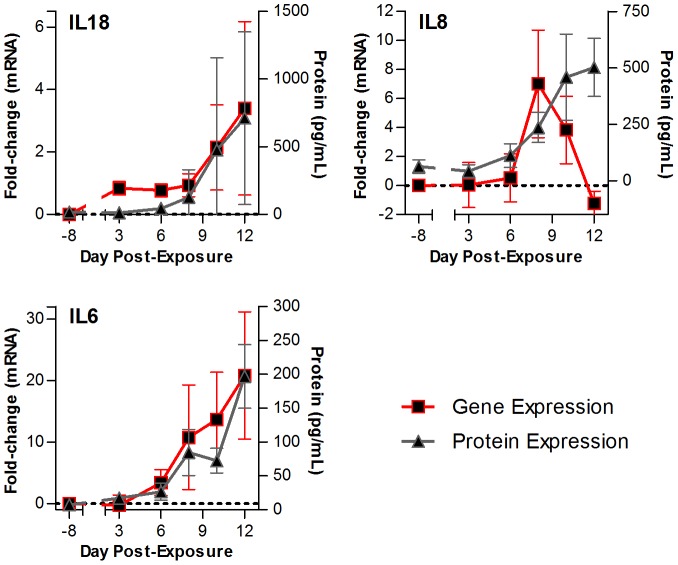
Figure 6. Comparison of the cytokine gene expression with the cytokine levels in the plasma of LASV-exposed NHPs.
Line graph to show the comparison of gene expression (red line) to the amount of cytokine detected (in pg/mL, grey line) in the plasma of LASV-exposed NHPs over the course of the disease. Shown here are probes for IL18 (top left panel), IL8 (top right panel), and IL6 (bottom left panel). Error bars represent S.E.

