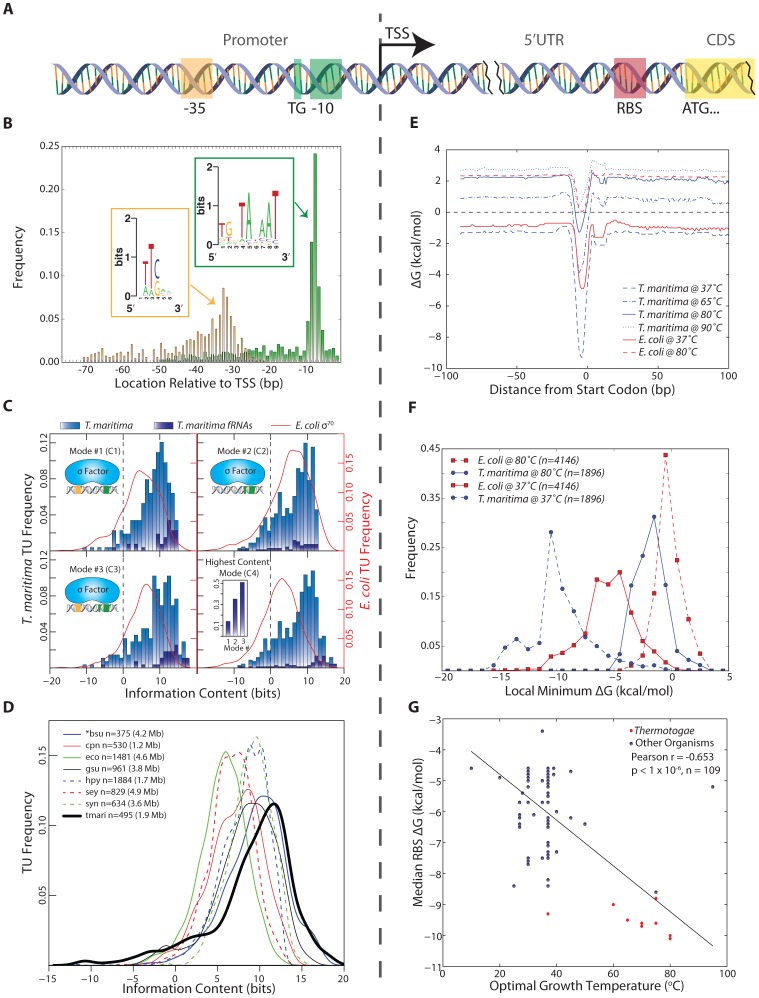
Figure 2. Identification and quantitative comparison of genetic elements for transcription and translation initiation.
(A) Schematic showing the position of the promoter upstream of the TSS and the RBS upstream of the translation start codon. (B) The genomic position of the 3′ end of each promoter element is shown relative to the TSS for all T. maritima TUs. Promoter elements were identified using a gapped motif search for a −35 hexamer and a −10 nonamer. This revealed an E. coli σ70 promoter architecture for the housekeeping sigma factor of T. maritima, RpoD. The motif for both promoter elements is displayed as a sequence logo (insets). (C) The relative binding free energy of σ70 is captured using information content. Each panel shows the distribution of promoter information content for T. maritima and E. coli. Mode 1 (C1) calculates information content based on σ70 contacts with the −35 and −10 hexamer promoter elements (ntmari = 265, ntmari_fRNA = 38, neco = 650). Mode 2 (C2) represents binding to the extended −10 promoter (ntmari = 676, ntmari_fRNA = 57, neco = 1,481). Mode 3 (C3) represents σ70-binding to both the −35 and the extended −10 promoter elements (ntmari = 274, ntmari_fRNA = 37, neco = 657). (C4) shows the distribution of information content for all promoters when only the highest scoring mode is considered (ntmari = 676, ntmari_fRNA = 57, neco = 1,481). The inset shows the highest distribution of functional RNAs across the modes. (D) The σ70 binding modes from (C) were used to calculate the promoter information content for seven additional bacterial species. Analogous to (C4), the distribution of information scores when only the highest bit score mode is considered is shown. The organism abbreviations correspond to the following: bsu, Bacillus subtilis; cpn, Chlamydophila pneumoniae CWL029; eco, Escherichia coli K12 MG1655; gsu, Geobacter sulfurreducens PCA; hpy, Helicobacter pylori 26695; sey, Salmonella enterica subsp. enterica serovar Typhimurium SL1344; syn, Synechocystis sp. PCC 6803; tmari, T. maritima MSB8. The genome size is given in paranthesis. *bsu data is extracted from a highly curated source that is a collection of small-scale experiments and, as such, this distribution is not a genome-scale assessment of promoter strength. (E) The calculated median RBS ΔG for all genes based on the position relative to the start codon. Temperature profiles are shown for T. maritima at 37°C (for comparison), 65°C (lower growth limit), 80°C (growth optimum) and 90°C (upper growth limit). Similar profiles are shown for E. coli at 37°C (optimal) and 80°C (for comparison). (F) The local minimum RBS ΔG for all genes in a 30 nt window upstream of the annotated start codon generated for T. maritima and E. coli at 37°C and 80°C. (G) Similar to (F), the median of the local minimum RBS ΔG was calculated and plotted for 109 bacteria against their optimal growth temperature. Species in the Thermotogae phylum (n = 15) are shown in red.

