
Figure 3. Arrangement of genomic features contained within promoter-containing intergenic regions (PIRs).
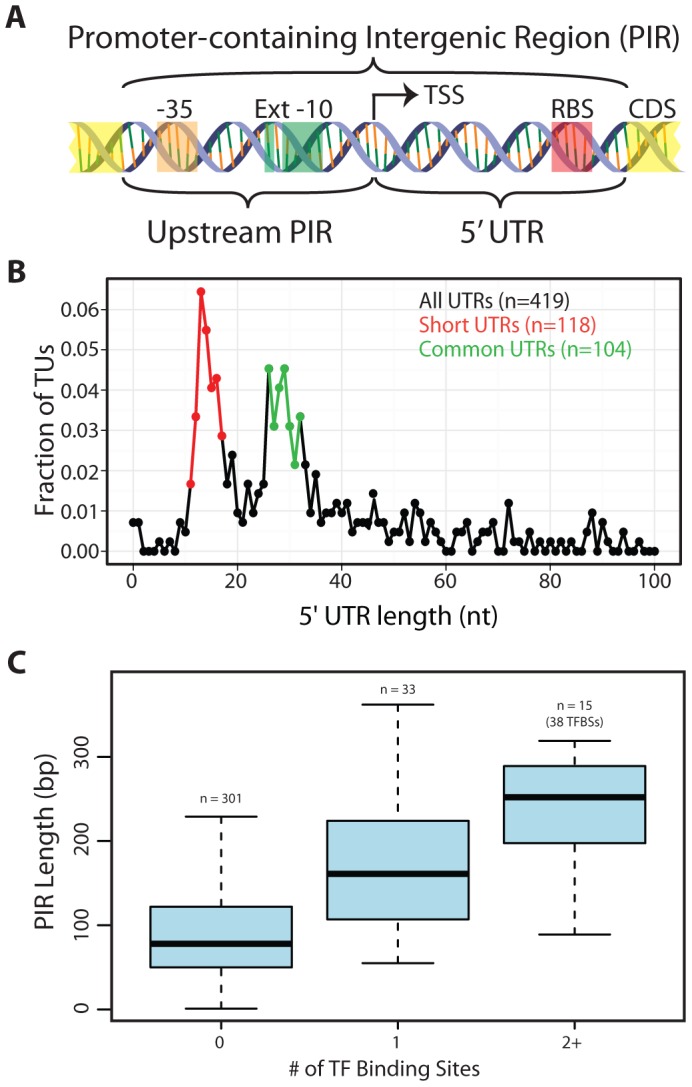
(A) Schematic of the two subdivisions of the PIR and the genetic elements they typically carry. (B) The 5′UTR distribution is shown for all TUs with an experimentally identified TSS. The Short 5′UTR group (11–17 nt) is shown in red. The Common 5′UTR group (26–32 nt) is shown in green. Transcripts with an annotated functional RNA as the first feature were omitted from the analysis. Though only the first 100 nt are plotted, frequencies are based on the entire set of 5′UTR lengths. (C) A quartile plot of the length distribution of PIRs is shown. PIRs are grouped according to the number of TF binding sites they contain (no TF, a single TF or multiple TFs).