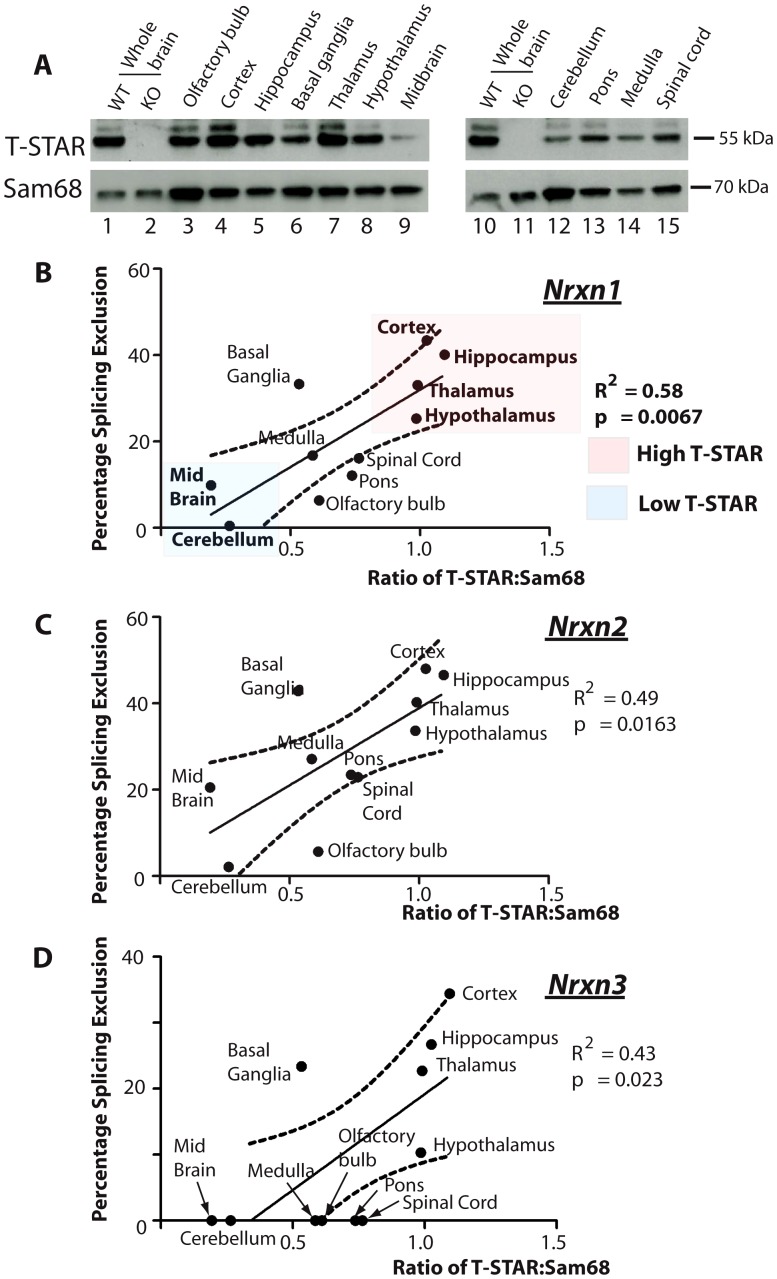
Figure 6. T-STAR protein concentration correlates with Nrxn1-3 AS4 alternative splicing patterns.
(A) Expression levels of T-STAR and Sam68 protein in different regions of the mouse brain were measured using Western blotting. The same filters were first probed with antisera specific for T-STAR, and then stripped and reprobed with an antisera specific for Sam68. (B–D) Levels of Nrxn1-3 AS4 Percentage Splicing Exclusion in each brain region plotted against the ratio of T-STAR: Sam68 protein quantified from the Western blot shown in (A). The dashed line is the 95% confidence limit of the best fit line.

