
Figure 2.
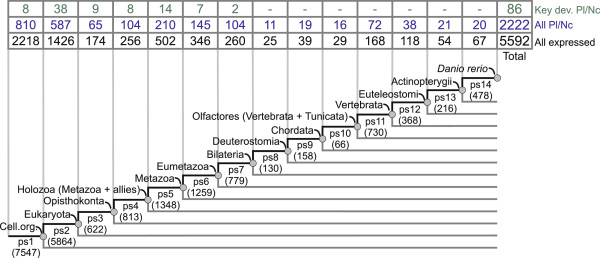
Phylostratigraphic distribution of the zebrafish genes on the consensus phylogeny. A consensus phylogeny that spans from the origin of the first cell to Danio rerio. Numbers in parentheses denote the total number of genes per phylostrata (ps1-ps14) across the zebrafish genome. The table above the phylogeny shows distributions of different categories of zebrafish genes. The numbers for the total set of genes with spatially restricted expression [57] are shown in the bottom row of the table (black). A subset of genes with expression in the cranial placodes and the neural crest (All Pl/Nc) is shown in the middle row (blue). A set of placode and neural crest key developmental genes (Key dev. Pl/Nc) that are reported in the literature [17,52] is shown in the upper row (green).