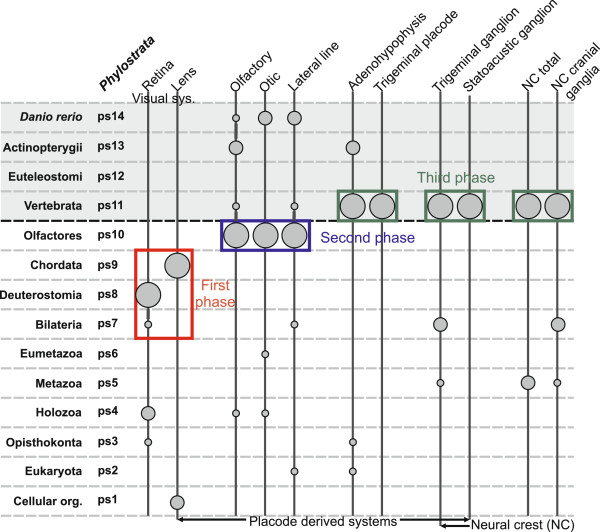
Figure 8.
Cranial placodes and sensory neural crest during head development in zebrafish. Phylogenetic levels (phylostrata) from the ancestor of the cellular organisms (ps1) to the present day zebrafish (ps14) are shown at the left. The gray shaded area marks the vertebrate section of the phylogeny. For all studied parts of the sensory system (Figures 2, 3, 4, 5, 6 and 7) a simplified version of the phylostratigraphic profile is shown by the vertical lines and the corresponding circles. An adaptive signal with the strongest amplitude is represented by the largest circle, the second highest signal is marked by a medium size circle, and all other overrepresentation signals are marked by circles of the smallest size. Only statistically significant signals are shown. The three phases in the evolution of sensory system are labeled by different colors (first phase – red, second phase – blue, and third phase – green).

