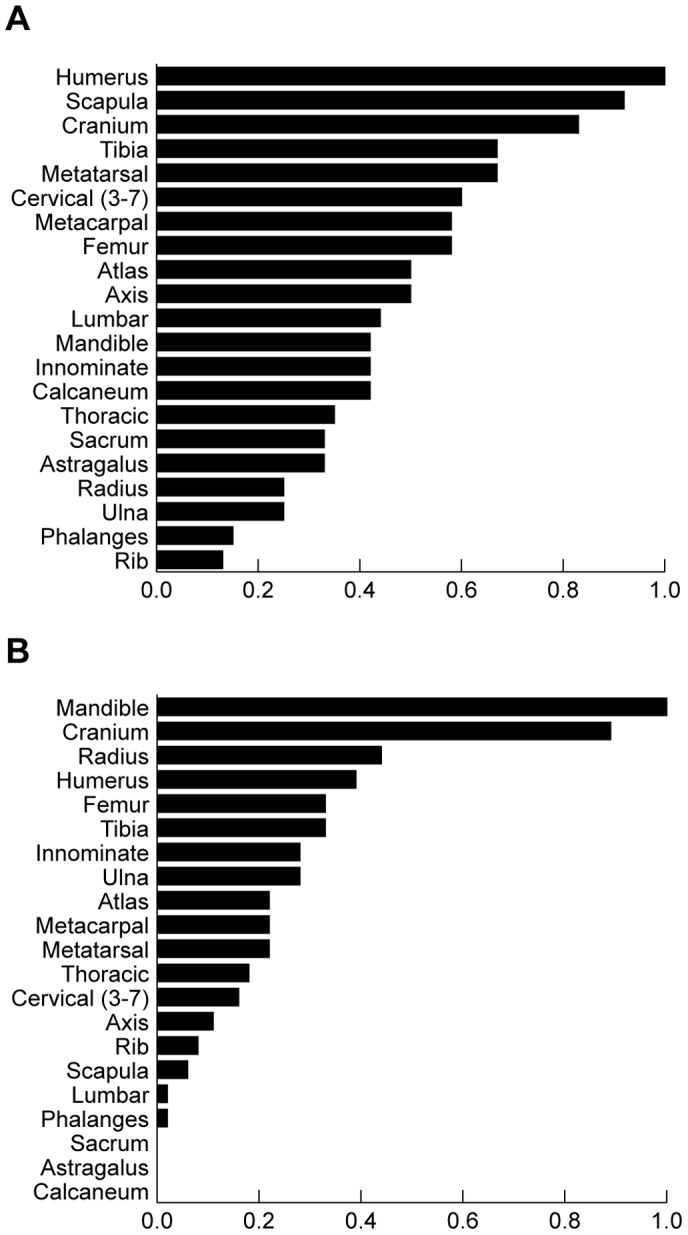
Figure 5. Skeletal element representation for (A) small and (B) medium-sized bovids, Bed KS-1.

Abundance data presented as percent minimum animal units (%MAU), calculated following the literature [43]. KJS data derived from Table S3. 100% MAU = 6 for small bovids, 9 for medium-sized bovids. Similar patterns of skeletal element representation are present in Beds KS-2 and KS-3.
