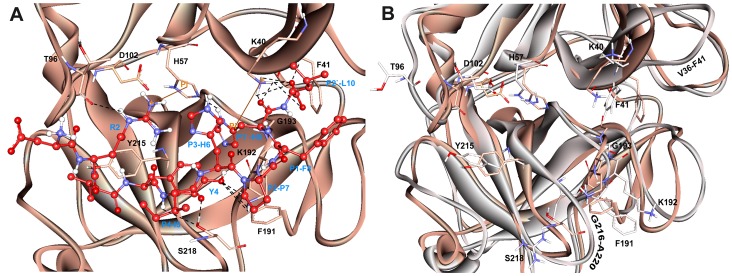
Figure 7. Active site of the substrate (Ang I) complex of the enzyme.
(A) Amino acid residues and bound substrate are shown in thin stick and ball-stick forms, respectively. Residues of substrate are shown in red color and labeled in blue color. Hydrogen bonds are shown in black dashed lines. (B) The structural changes observed between the active site regions of apoform (grey) and human chymase-substrate complex (orange). The amino acid residues are shown in thin stick form. Only polar hydrogen atoms are added for clarity.

