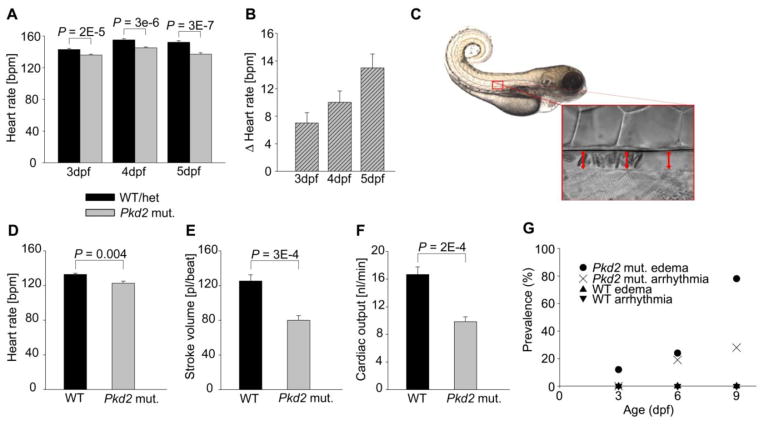
Fig. 2.
Pkd2 mutant zebrafish show impaired cardiac function. (A) Heart rate in zebrafish embryos at 3, 4, and 5 dpf. The WT/het group consists of siblings of pkd2 mutants with normal wildtype phenotype (no dorsal body curvature). Therefore 2/3 of the WT/het group is heterozygous for the pkd2 mutation, and 1/3 is WT. WT/het 3 dpf n = 144, 4 dpf n = 149, 5 dpf n = 113. Pkd2 mutant (mut.) 3 dpf n = 144, 4 dpf n = 150, 5 dpf n = 113. (B) Difference between the mean heart rates of the WT/het and the pkd2 mutant zebrafish. The pkd2 mutant mean heart rate for each time point was subtracted from the WT/het mean heart rate for the same time point. Propagation of error was used to determine the error bars. (C) Blood flow was imaged in the dorsal aorta of 3 dpf zebrafish. Comparison of heart rate (D), stroke volume (E), and cardiac output (F). WT n = 6, pkd2 mut. n = 7. Pkd2 mutant zebrafish develop edema and arrhythmias (G). Zebrafish embryos (n/group = 27–41) were imaged and cardiac videos recorded at 3, 6, and 9 dpf. All observed arrhythmias were AV blocks, where part of the atrial impulses failed to induce ventricular contraction. Data shown as mean ± s.e.m.

