
Fig. 4.
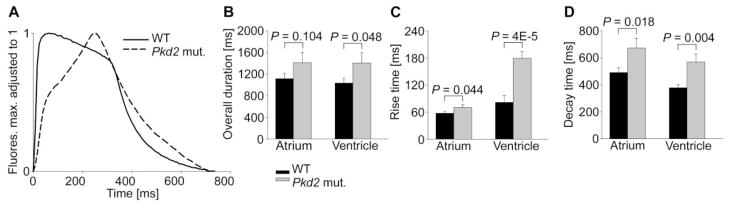
Pkd2 mutant zebrafish hearts show aberrant calcium cycling. (A) Representative spontaneous ventricular calcium transients. Comparison of calcium transient duration (B), rise time from 10% to 90% of peak amplitude (C), and decay time from 90% to 10% of peak amplitude (D). WT n = 14, pkd2 mut. n = 15. Data shown as mean ± s.e.m.