
Figure 2. Correlation between plasma HbA1c levels and NKG2D expression on NK cells assesed by Spearman’s correlation.
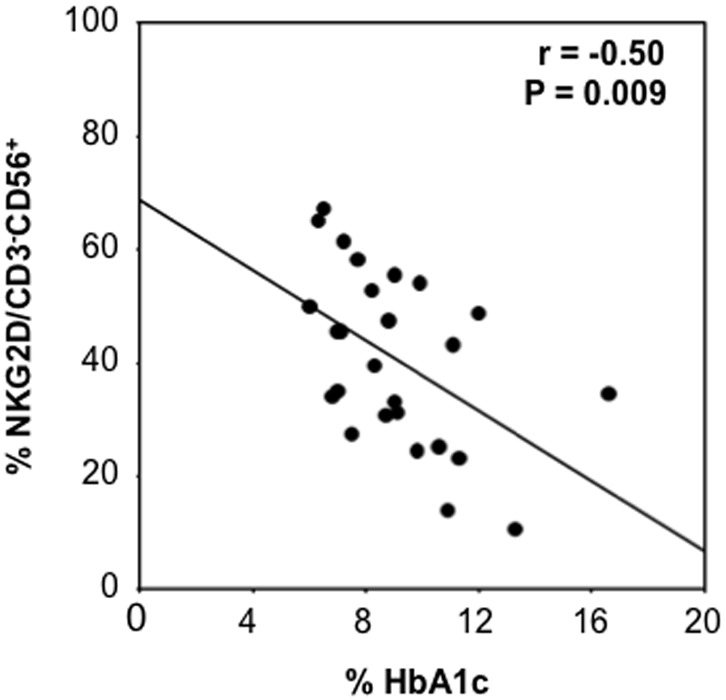
A significant inverse correlation (n = 32, r = −0.5; P = 0.009) is revealed between the main marker of diabetic metabolic control and NKG2D expression on NK cells.